The number traders call the fear index measures no fear at all. It measures the price of S&P 500 options, and its worst readings have marked some of the best moments in history to buy. That gap between the nickname and the mechanism is where most people go wrong.
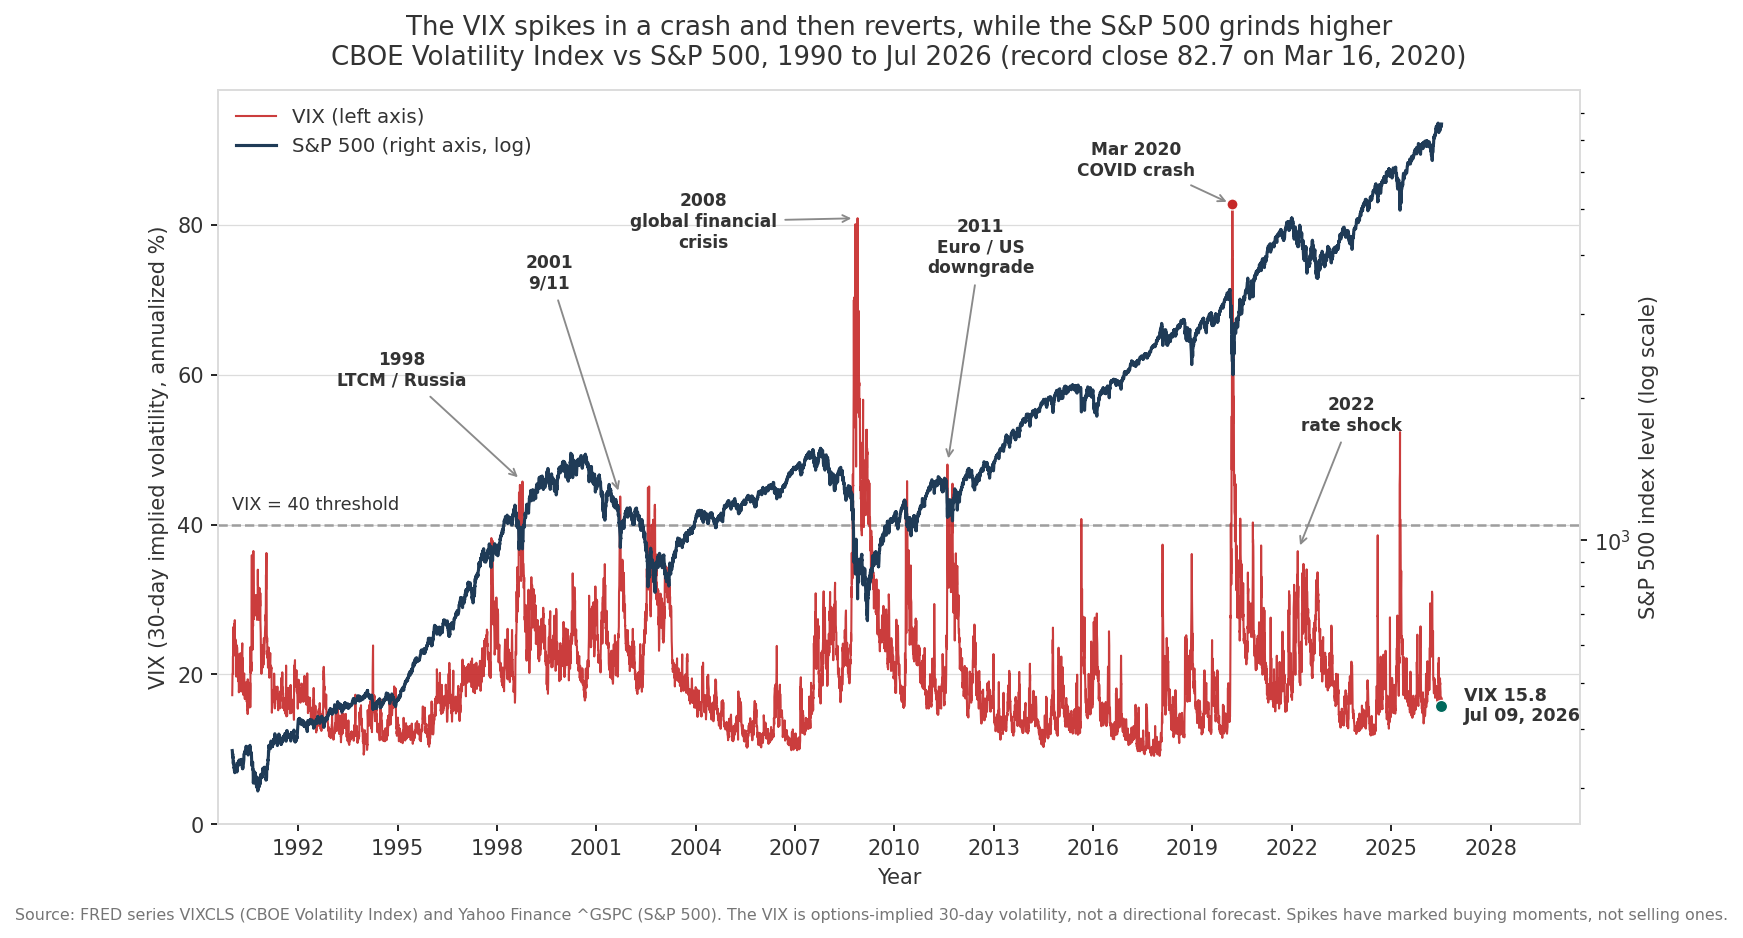
The VIX is the CBOE Volatility Index. I pulled its full daily history from the Federal Reserve series VIXCLS, which runs from January 1990, and I paired it with the daily S&P 500 close from Yahoo Finance over the same window. Both series run to 2026 in the data behind this article. What the numbers show is a measure that behaves nothing like the emotion it is named after, and a trading rule built on the nickname that has lost money for decades. The chart below plots the VIX against the S&P 500 across the full history.
What the VIX actually is
Start with the machine, then worry about the story. The VIX is an estimate of how much the S&P 500 is expected to move over the next 30 days, expressed as an annualized percentage. A reading of 20 says the options market is pricing roughly a 20 percent annualized standard deviation of returns for the coming month, which works out to about 5.8 percent over that single month. A reading of 40 doubles that expected range. The index is computed from the live prices of a wide strip of S&P 500 put and call options across many strike prices, so it is a snapshot of what people are paying, right now, for the right to buy or sell the index later.
That word “expected” is the whole point. Option prices carry an implied volatility, the level of future movement that makes the observed price fair under an options-pricing model. When traders bid up options, implied volatility rises, and the VIX rises with it. The index reads the collective price tag on future movement and reports it as a single number. It is a forward-looking quantity. It describes the size of the move the market is bracing for, in either direction.
Compare that to realized volatility, which is the standard deviation of returns the index actually delivered over some past window. Realized volatility is a measurement of what already happened. It is backward-looking by construction, computed from a settled history of closes. The VIX is the market’s paid-for guess about the month ahead. One is a memory. The other is a wager. In control terms, realized volatility is the recorded output of the system, and the VIX is the estimator running ahead of it, priced in dollars by people with money at stake.
Two things follow immediately from this definition, and both cut against the fear story. First, the VIX has no direction in it. A month of large gains and a month of large losses can price the same implied volatility, because an option protects against movement, and movement has two sides. High VIX does not mean the market will fall. It means the market is expected to swing hard. Second, the VIX is not a sentiment survey. Nobody is polled about their feelings. The reading is whatever option prices imply, and option prices are set by hedging demand, dealer positioning, and supply, as much as by any raw emotion.
Why it spikes in a crash
If the VIX carries no direction, why does it lunge upward in every crash? The chart in this article shows the pattern cleanly. The red VIX line sits low and quiet for long stretches, then stabs upward at exactly the moments the blue S&P 500 line is falling. The two look joined at the hip during selloffs.
The link is real, and it runs through option prices, not through the direction of the market. When stocks fall fast, three things happen at once. Realized volatility jumps, because prices are moving more each day, and implied volatility tends to track it. Demand for downside protection surges, because investors and funds scramble to buy puts, and that buying pressure lifts option prices directly. And the expected range of the next month widens, because a market that just fell 5 percent in a day is plainly capable of doing it again. All three push implied volatility up, so all three push the VIX up. The spike is the options market repricing risk in real time, and repricing it upward is what a falling market forces.
The crash link explains the record. Across the full 1990 to 2026 history in the FRED data, the VIX averaged 19.45 and had a median of 17.61, so its normal home is the high teens. Its all-time-high close was 82.69, set on March 16, 2020, during the COVID crash. That reading did not appear because investors were 82 units frightened. It appeared because the S&P 500 was moving in daily lurches of 9 and 12 percent, downside protection was being bid frantically, and the priced-in range for the coming month blew out to match. The number is the symptom of a violent price, and the price is what you can see and act on.
The buy signal hiding inside the panic
Here is where the nickname does real damage. Treat the VIX as a fear gauge and the intuitive move is to sell when it is high, because high fear feels like danger. The history says that instinct has been almost exactly backwards.
Volatility mean-reverts. Fear, if that is what you want to call it, does not stay maxed out. A market cannot keep moving 10 percent a day for long, so extreme implied volatility collapses back toward its normal range within weeks or months. That is visible all over the chart. Every tall red spike, the 1998 LTCM and Russia crisis, the 2001 shock, the 2008 global financial crisis, the 2011 euro and downgrade scare, the March 2020 crash, and the 2022 rate shock, is followed by a fall back toward the high teens. The spikes are transients, not new levels. And because the spike coincides with a beaten-down market, the reversion tends to coincide with a recovery.
I measured this directly. Taking every trading session from 1990 to 2026 where the VIX closed above 40, which is 207 sessions out of 9,193, I computed what the S&P 500 did over the following 3, 6, and 12 months, and compared it to the average across all sessions. The gap is large and it points one way. Over the next 3 months, high-VIX days were followed by a 7.26 percent average S&P 500 gain, against 2.43 percent for the unconditional average. Over 6 months the split was 17.25 percent against 4.87 percent. Over 12 months it was 33.00 percent against 10.16 percent, and 96.1 percent of those high-VIX starting points were followed by a positive year. Buying when the index screamed danger beat the average buy by more than 22 percentage points over the following year.
Those numbers come with an honest caveat. High-VIX days cluster inside a handful of crises, so the 207 observations are not 207 independent bets. They are a few big episodes sampled day by day, and each episode could have gone worse than it did. The point is not a precise forecast. The point is that the historical record shows extreme volatility marking beaten-down prices that recovered, and it shows no support at all for the reflex of selling into a VIX spike.
The single cleanest case study is the record itself. After the VIX closed at 82.69 on March 16, 2020, the S&P 500 sat at 2,386. Roughly 18 months later, on September 16, 2021, it closed at 4,474, a gain of 87.49 percent, computed from the Yahoo Finance daily closes. The most frightened reading in the history of the fear index sat on top of one of the great buying moments of the modern market. Anyone who read 82 as a sell signal sold the bottom.
The hedge that bleeds
If a high VIX has been so good to buyers, the next thought is obvious. Why not just own volatility, so a portfolio profits when the next crash hits? The problem is that you cannot buy the VIX. It is an index, a calculated number, with no shares to hold. What you can buy are products that track VIX futures, such as the exchange-traded note VXX and its relatives, and those products carry a cost that grinds them down even when the VIX goes nowhere.
The cost is structural and it has a name. VIX futures usually trade in contango, which means contracts for later months cost more than contracts for sooner months, because the market charges a premium for volatility protection further out. A fund tracking these futures has to keep selling the cheaper near-month contract as it expires and buying the pricier next-month contract, so it sells low and buys high on a schedule, every single month. That mechanical roll bleeds value whenever the futures curve slopes upward, which is most of the time. The result is a product that can lose money for years during calm markets, then gain sharply in a crash, and still end far underwater across a full cycle. Volatility products of this kind have delivered some of the most severe long-run decay in the entire ETF landscape, and several have been reverse-split or shut down after destroying most of their value.
The lesson is that the mean-reversion which makes a high VIX a buying signal for stocks is the same force that makes owning volatility a losing proposition over time. Because volatility falls back toward its normal range, the futures curve prices in that fall back, and a holder pays for the decline in advance through contango. The crash payoff is real when it comes. The waiting is expensive enough to swallow it.
Reading the instrument correctly
The chart shows a latest VIX of 15.84 as of 2026, sitting below its long-run average of 19.45. That is the market pricing a calm month ahead. It is a description of expected movement, dated to a specific day, and it will be a different number by the time you read this. Treat it as a live gauge, not a permanent verdict.
The whole point holds up when you keep the mechanism in front of the story. The VIX reads the price the options market puts on movement over the coming 30 days. It rises in crashes because option prices rise in crashes, and it falls back because extreme movement cannot persist. Its highest readings have sat on top of beaten-down prices that recovered, which is why selling a spike has been a mistake and why the fear index is a poor guide to fear and a decent contrarian tag on cheap stocks. Read it as an engineer reads a strain gauge under load. A high reading tells you the system is stressed and moving hard. It does not tell you the bridge is about to fall, and it certainly does not tell you to jump off.