A stock split does not make you a dollar richer. The instant it happens, your holding is worth exactly what it was worth the second before. Everything that feels like it changed is a change of units, and units are not wealth.
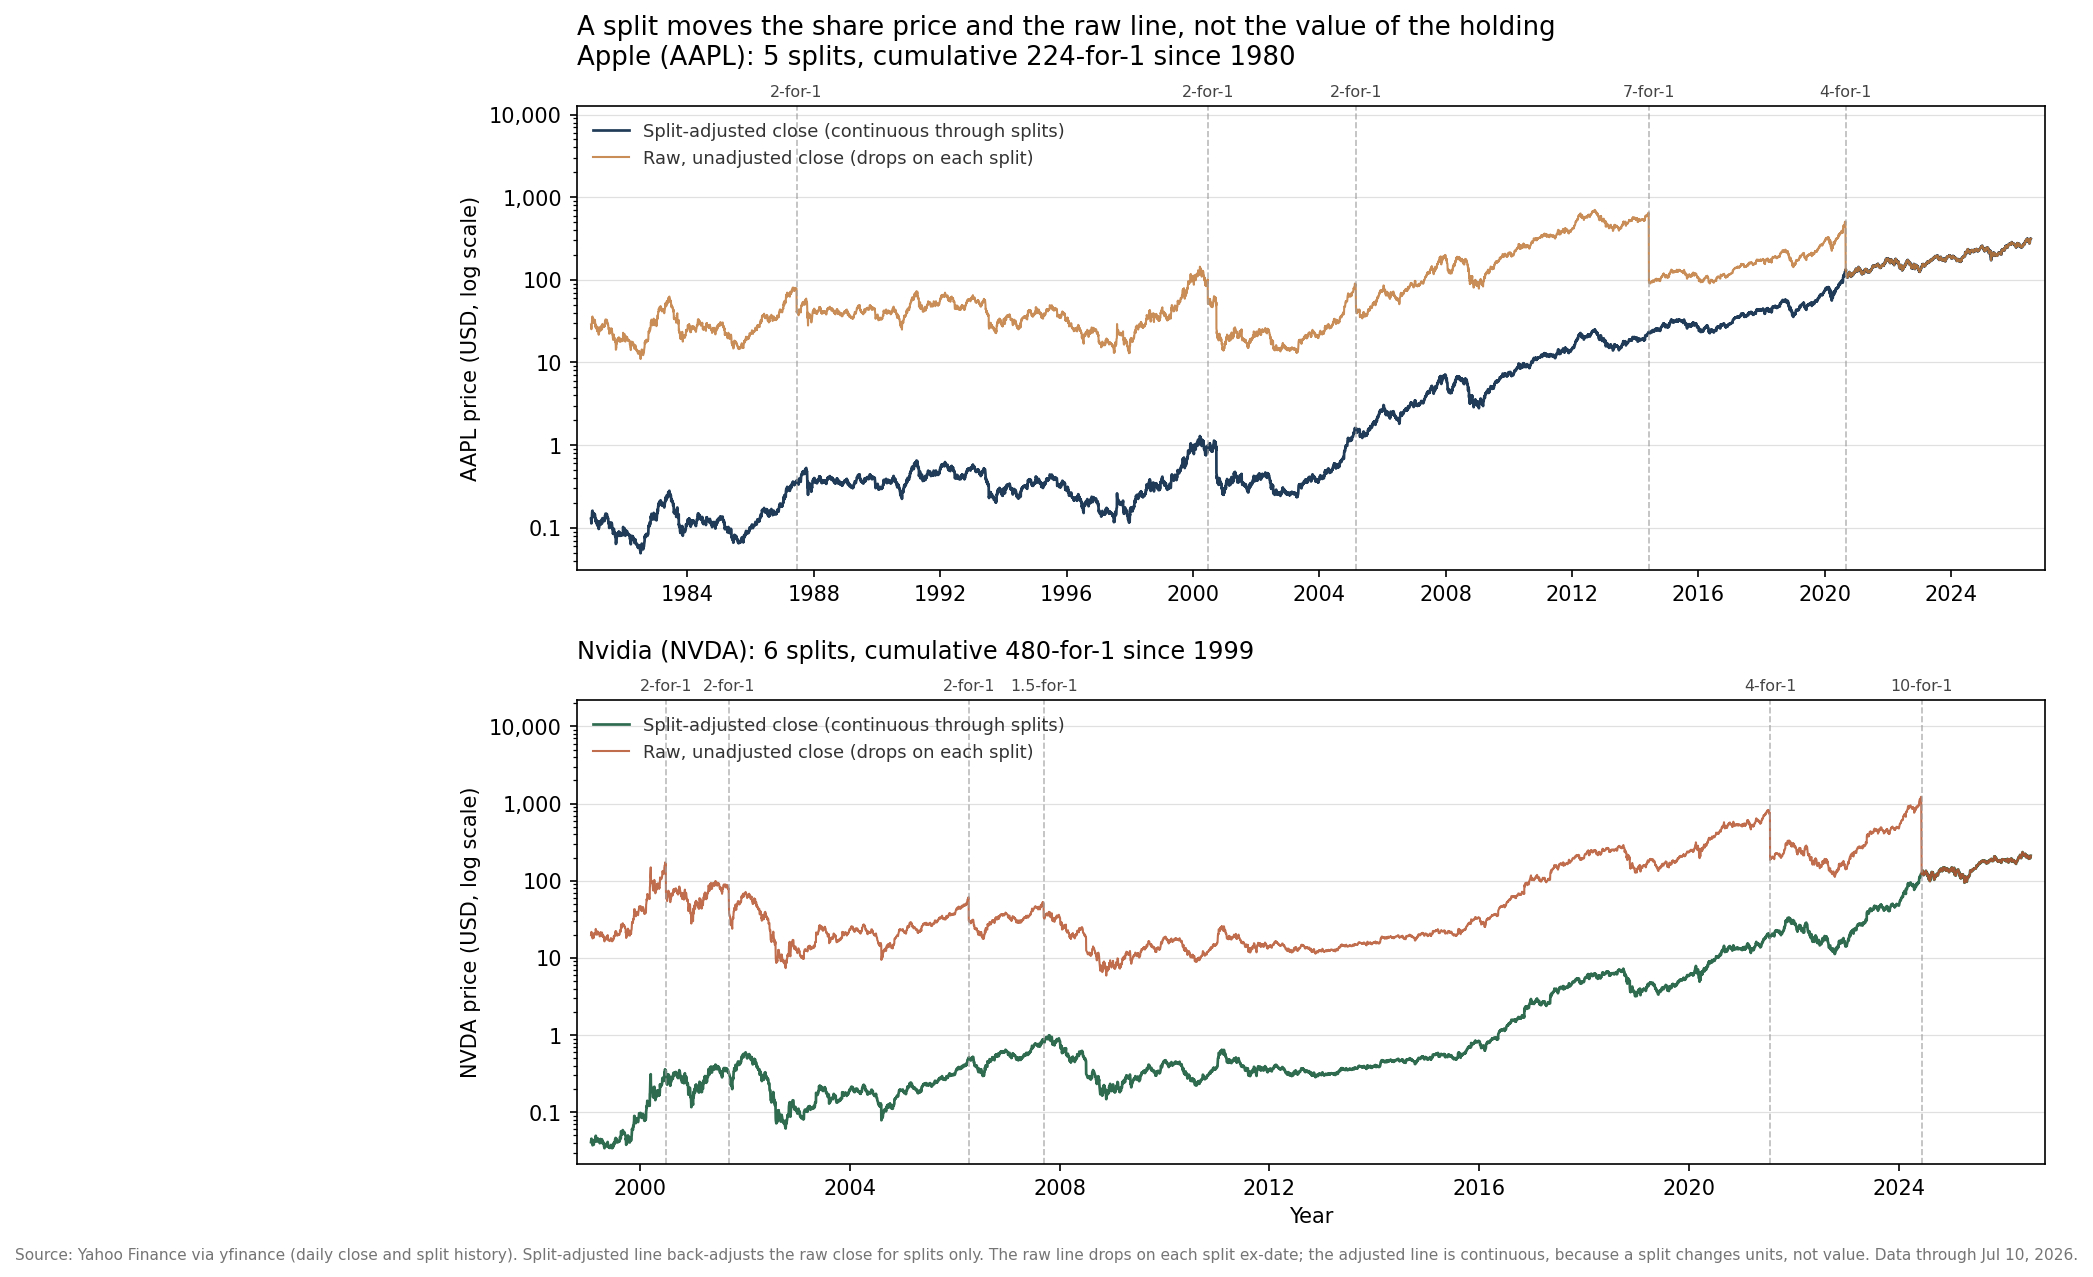
I pulled the full daily price history and the complete split record for Apple (AAPL) and Nvidia (NVDA) from Yahoo Finance through 2026. Apple has split its stock five times since it went public in 1980, for a cumulative factor of 224-for-1. Nvidia has split six times since 1999, for a cumulative factor of 480-for-1. Those two records are enough to show the whole mechanism, because a split is one of the few corporate events whose effect on your net worth can be computed exactly, and the answer is always zero. Here is what all eleven of those splits look like on the price charts, with each stock plotted two ways, once in the raw price that printed on the tape and once split-adjusted.
The arithmetic that cannot create value
A forward stock split multiplies the number of shares outstanding and divides the price by the same factor. The two moves are locked together. In a 10-for-1 split, every share becomes ten shares and the price of each becomes one tenth of what it was. A single share worth 1,000 dollars turns into ten shares worth 100 dollars each. Ten times one hundred is one thousand. Your position is unchanged, the company’s market capitalization is unchanged, and the fraction of the business you own is unchanged.
Nvidia ran exactly this play in June 2024, and the real numbers make it concrete. In the Yahoo Finance data, Nvidia closed at 1,208.88 dollars a share on Friday, June 7, 2024, the last session before the split. The following Monday, June 10, the same holder owned ten shares at 121.79 dollars each. A block that read as one line worth about 1,209 dollars on Friday read as ten lines worth about 1,218 dollars on Monday. The small difference between those two numbers is not the split. It is the ordinary market move that the stock made that day, a gain of 0.75 percent computed from the split-adjusted closes, the same kind of wiggle it could have on any random Monday.
The chart above shows the mechanism at the level of the whole price history. For each stock I plot two lines. The lower line is the split-adjusted close, which Yahoo Finance publishes by dividing every past price down through each split so the series is measured in today’s shares. That line is continuous. It runs through every split date without a step, because on a split-adjusted basis nothing happened. The upper line is the raw, unadjusted price, the number that actually printed on the tape on the day. That line drops hard at every split. Apple’s raw price fell by half at each of its three 2-for-1 splits, by about 86 percent at its 7-for-1 split in June 2014, and by 75 percent at its 4-for-1 split in August 2020. Nvidia’s raw price fell 90 percent on its 10-for-1 split in June 2024. The vertical drops in the upper line and the smoothness of the lower line are the same event drawn two ways. One draws the units. The other draws the value.
This is why the drops are not losses. A price cut of 90 percent that arrives with ten times as many shares leaves the product untouched. Apple’s 4-for-1 split in 2020 tells the same story from the data. The stock closed at 499.23 dollars on August 28, 2020, and opened the next session as four shares near 129 dollars each. Anyone who saw a 500 dollar stock trading at 129 and thought it had crashed was reading the price without reading the share count. The split cut the price tag and quadrupled the tags, and four times roughly 129 is roughly what one share of 500 had been.
Why a company splits at all
If a split changes nothing about value, the obvious question is why boards bother. The honest answer is that every reason is about human behavior and market plumbing, not about the business.
The oldest reason is psychological accessibility. A share priced at 3,000 dollars feels out of reach to a small investor even though a brokerage account can buy a single share or, at many brokers today, a fractional slice of one. Boards have long believed that a lower nominal price widens the pool of buyers and makes the stock feel ownable. The number on the sticker moves the buyer even when the value behind it does not. That belief is why household names have historically kept their share prices in the tens or low hundreds of dollars through repeated splits.
The second reason is options-market liquidity, and it is more concrete. Standard equity options in the United States are written on lots of 100 shares. When a stock trades at 1,200 dollars, one option contract controls 120,000 dollars of underlying, which is a large and clumsy unit for anyone hedging or trading in modest size. Cut the price to 120 dollars with a 10-for-1 split and one contract controls 12,000 dollars. The options chain becomes usable for far more participants, spreads tend to tighten, and trading activity around the stock can rise. That plumbing effect is real, and it is one reason a company whose shares have run up into four digits will schedule a split.
A third reason shows up occasionally around index mechanics. The Dow Jones Industrial Average is price-weighted, meaning a component’s influence depends on its raw share price and not on its market value. A very high-priced stock can distort a price-weighted index or be kept out of one, so a split can matter for index inclusion or weight in that narrow case. Apple’s 7-for-1 split in 2014 is often read partly through this lens, since it brought Apple’s raw price down from the high hundreds into a range that fit more comfortably inside the price-weighted Dow, which Apple joined in 2015. The great majority of the market is capitalization-weighted and does not care about nominal price at all, so this reason is the exception, not the rule.
None of these motives touch earnings, cash flow, margins, or competitive position. A split rearranges the units the market quotes the company in. The business on the morning after is the business from the night before.
The announcement drift and what it actually signals
Here is where the story gets more interesting, because the academic record shows that splits are not entirely inert in the way prices move around them. The value identity holds exactly on the split date. The behavior of the stock around the announcement is a separate question, and the answer is a small, documented, positive drift.
The foundational study is Fama, Fisher, Jensen, and Roll in 1969, which examined 940 splits and found that once you adjust for the overall market, the split itself conferred no abnormal performance afterward. What they did find was that splits tended to follow a run of good news and rising dividends, so the split was a marker of a company that had already been doing well. The split was the flag, and the good performance had come before the flag went up.
Later work sharpened the picture. Ikenberry, Rankine, and Stice, studying 1,275 two-for-one splits announced between 1975 and 1990, reported an average abnormal return of about 3.4 percent in the days right around the split announcement, and they documented positive excess returns that continued afterward, on the order of 8 percent in the following year and roughly 12 percent over the following three years relative to comparable firms. They read this as a signaling effect. A management team that splits its stock is publicly betting that the lower price is a good level to grow from, which is a soft statement of confidence that the recent strength is not about to reverse. Companies do not like to split and then watch the price sink back to where a reverse split becomes tempting, so the willingness to split carries information about what insiders expect.
The engineering way to say it is that a split is a cheap signal with a small reputational cost attached, so it carries a little information even though it carries no cash. Confidence is the payload. The split is the envelope. That reading also explains why the drift is modest and why it is best treated as a mild tailwind and not a trading system. The information in the signal is small, the studies span specific historical windows, and the effect is an average across many firms with wide scatter around it. A split announcement is a reason to look closer at a company that is evidently doing well. It is not a reason to buy blindly, and it is certainly not free money.
Reverse splits run the machine backwards
The same arithmetic runs in reverse, and the reverse case usually carries the opposite message. A reverse split divides the share count and multiplies the price. In a 1-for-10 reverse split, ten shares become one and the price is multiplied by ten, so a stock trading at 80 cents becomes a stock trading at 8 dollars with a tenth of the shares. As with a forward split, the value of the holding is identical the instant it happens.
What differs is the reason. Major exchanges impose minimum price rules. The New York Stock Exchange and Nasdaq generally require a listed stock to hold a price above one dollar, and a company that has drifted below that line for too long faces delisting. A reverse split is the standard tool for engineering the price back up over the threshold without changing anything real about the business. That is why a reverse split so often appears after a long decline, and why it functions as a distress signal even though the mechanics are neutral. The math is clean. The situation that usually triggers it is not. Research on reverse splits has generally found weak or negative performance in the periods that follow, consistent with the fact that the companies reaching for the tool tend to be the ones already in trouble. A forward split tends to arrive on the back of strength. A reverse split tends to arrive on the back of weakness. The direction of the split is a rough read on which way the company has been traveling.
Reading a split correctly
Look back at the two lines on the chart before you act on any split headline. The continuous split-adjusted line is the truth about your wealth, and it never once jumps at a split. The jagged raw line is the truth about the sticker price, and it drops every time. Confusing the two is the entire mistake. Apple compounded from a split-adjusted close near 13 cents in December 1980 to 315.32 dollars on 2026, and Nvidia rose to 210.96 dollars on the same date, and not one cent of that growth came from any of their eleven combined splits. The growth came from the businesses. The splits only changed the size of the pieces the market quoted them in.
So treat a forward split as what it is, a units change wrapped around a quiet signal of management confidence, worth a second look and never a reflex purchase. Treat a reverse split as a units change that usually points the other way. Read the share count next to the price every single time, because a price without a share count is a number with no meaning. Your wealth is the product of the two, and a split leaves that product exactly where it found it.