Across 27 calendar years of S&P 500 sector data, last year’s best sector repeated as this year’s best only 12 percent of the time. The leaders and laggards trade places constantly. That single fact is the honest heart of sector rotation, and it is where most of the strategies built on it quietly fall apart.
The S&P 500 is not one thing. It is eleven things wearing one ticker. The index committee sorts every company into one of eleven sectors under the Global Industry Classification Standard, the scheme S&P and MSCI use to bucket stocks by what they actually do. I pulled the full daily history of the SPDR Select Sector ETFs, which track those buckets, plus SPY for the whole index, from Yahoo Finance. The prices are dividend-adjusted, so each year-over-year change is a total return. The series run to 2026 in the data behind this article, and they give 27 complete calendar years from 1999 through 2025 for the nine sectors that launched in December 1998, with real estate joining in 2016 and communication services in 2019.
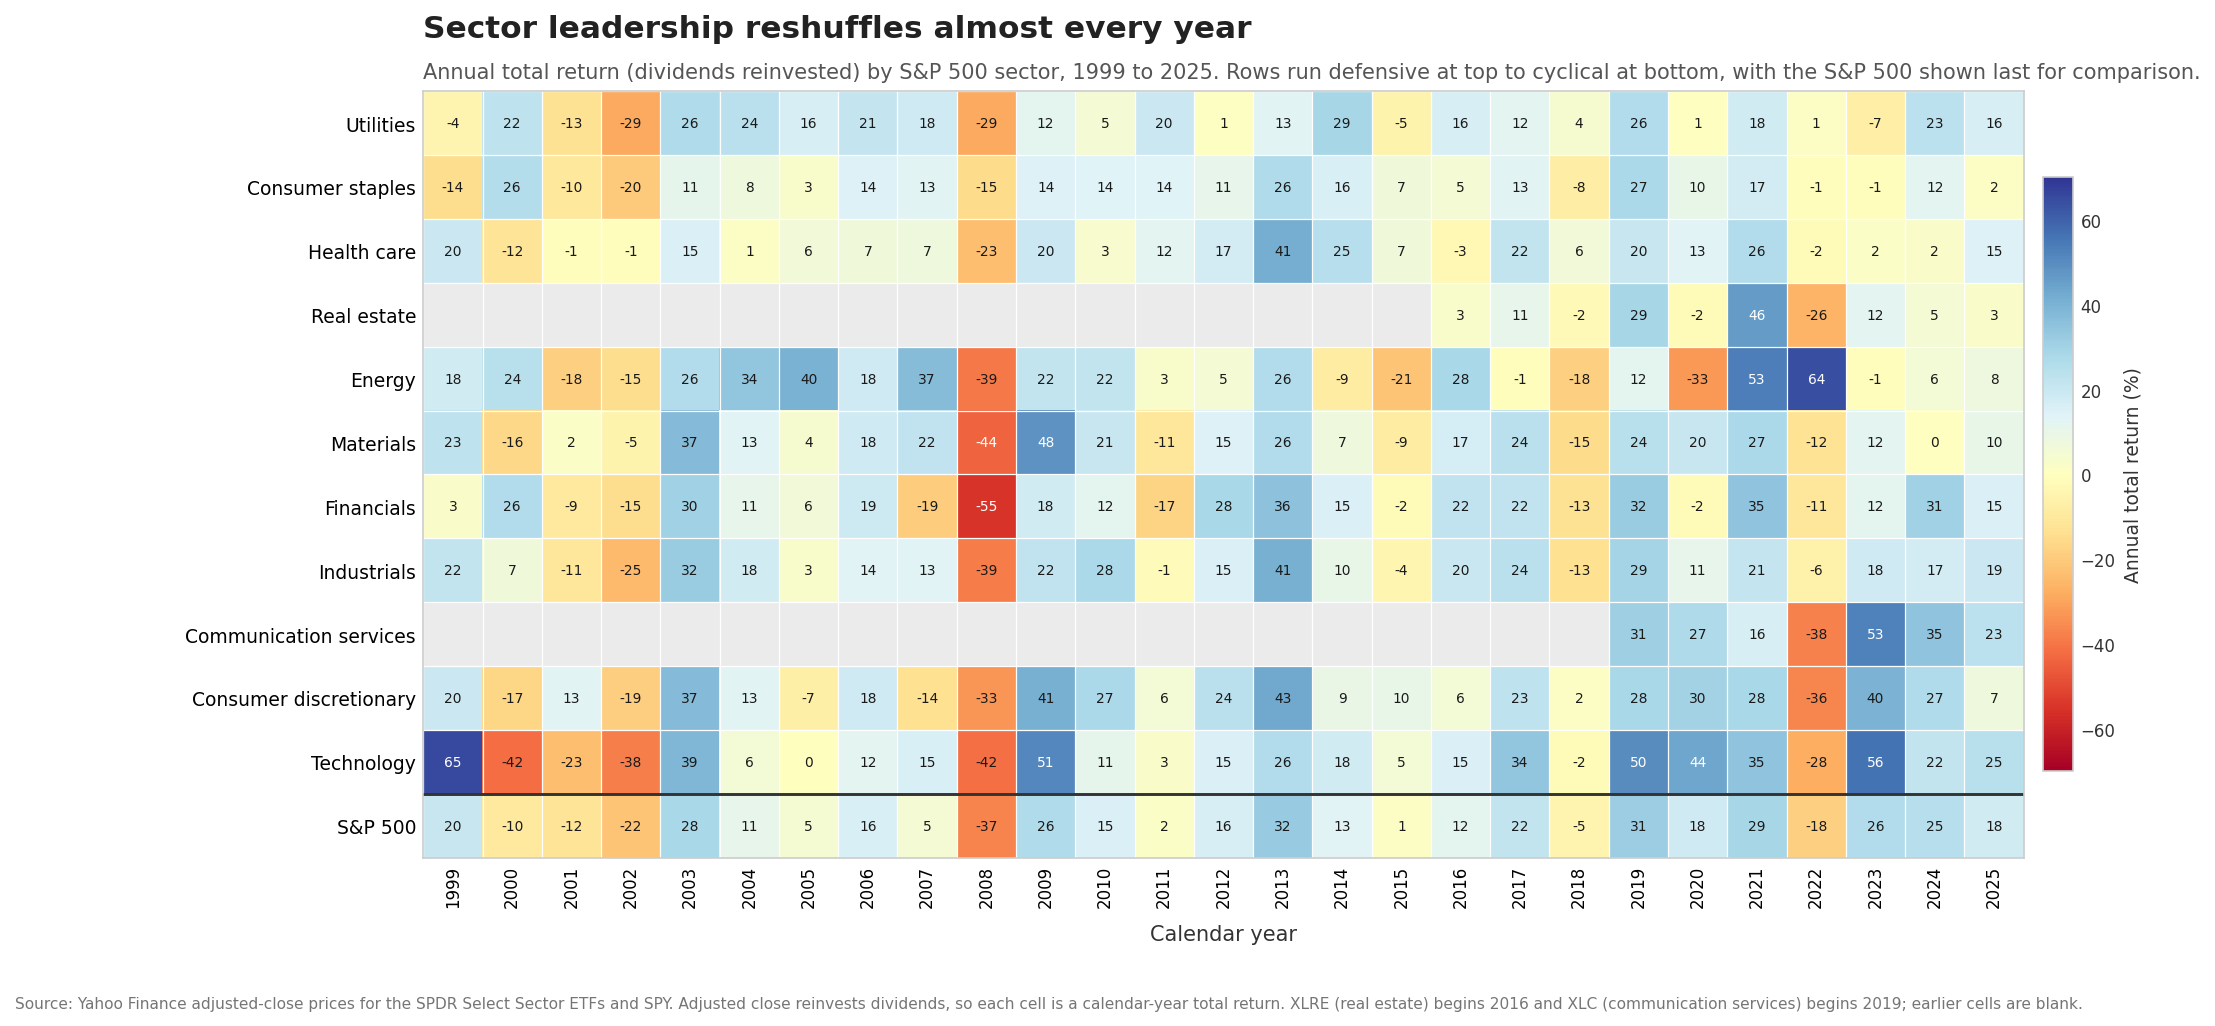
The heatmap below is that history laid out as a grid. Rows are sectors, ordered defensive at the top and cyclical at the bottom. Columns are years. Green is a good year, red is a bad one, and the numbers are the total returns. Read across any row and you see one sector’s ride through time. Read down any column and you see how wide the spread was in a single year. What jumps out is the churn. The green and red do not line up into neat rows. They scatter.
The eleven sectors and why they split
Group the eleven sectors by how they behave and two families appear. Defensive sectors sell things people buy no matter what the economy is doing. Utilities keep the lights on. Consumer staples cover groceries, soap, and toothpaste. Health care fills prescriptions. Demand for these holds steady through a downturn because the underlying need does not vanish when a recession hits. Their earnings are stable, their dividends tend to be reliable, and their stock prices move less than the market in both directions.
Cyclical sectors sell things people and businesses buy more of when times are good and defer when money gets tight. Technology sells the chips, software, and hardware that companies load up on during expansions. Consumer discretionary covers the cars, restaurants, and vacations that get cut first in a squeeze. Industrials build the machines and move the freight that track factory output. Materials dig up the copper and mix the chemicals that feed everything else. Financials sit slightly apart, geared to lending, credit, and the shape of the yield curve. These sectors swing harder than the market because their earnings swing harder.
Energy is its own animal. It marches to the price of oil more than to the domestic business cycle, which is why it shows up as both the best and the worst performer in different years of the grid. It led the field in 2004, 2005, and 2007, then again in 2021 at plus 53.3 percent and 2022 at plus 64.3 percent. It was the single worst sector in 2018, 2019, and 2020, bottoming at minus 32.7 percent in the 2020 crash. Same sector, opposite corners of the chart, driven by a commodity price more than by where the country sits in its expansion.
What the business cycle framework predicts
The reason anyone talks about rotation is that these two families tend to take turns, and the turns loosely follow the business cycle. Fidelity’s published research on sector investing, “The Business Cycle Approach to Sector Investing,” lays this out in four phases, and it is the cleanest named framework for the idea.
In the early phase, the economy is climbing out of recession. Credit loosens, rates are still low, and activity reaccelerates from a low base. Fidelity’s work finds the rate-sensitive and heavily cyclical sectors tend to lead here, consumer discretionary, financials, real estate, industrials, and materials, because they have the most operating leverage to a recovery. In the mid phase, the longest of the four, growth is healthy and steady, and no single group dominates for long, though technology has historically done well. In the late phase, the economy runs hot, inflation pressures build, and Fidelity finds the inflation-resistant sectors start to take over, energy and materials on the commodity side, and the defensive trio of health care, consumer staples, and utilities as investors grow cautious. In the recession phase, activity contracts, and the defensives hold up best because their demand is the least tied to the cycle.
The logic is sound and the mechanism is real. When corporate profits are accelerating, a business that can grow its earnings fast is worth chasing, and the cyclicals deliver that. When profits are contracting, a business whose earnings barely flinch is worth a premium, and the defensives deliver that. Money flows toward whichever quality the moment rewards. In control terms, the business cycle is a slow oscillation in the growth rate of corporate earnings, and sector leadership is the market’s attempt to track that oscillation and get paid for it.
What actually happened in the crashes
Theory is one thing. The grid lets us check it against the years that mattered most.
Look at 2008, the column where nearly everything is red. The S&P 500 returned minus 36.8 percent that year. The spread across sectors was enormous. Financials, the sector at the center of the mortgage collapse, fell 54.9 percent and finished dead last. At the other end, consumer staples fell only 15.0 percent, health care fell 23.3 percent, and utilities fell 28.9 percent. Every sector lost money, and the defensive trio still beat the index by double digits while the most cyclical corners took the worst of it. The framework’s recession call held. Defensives cushioned, cyclicals cratered, and the gap between best and worst sector was almost 40 percentage points inside a single year.
Now look at 2020, the year of the COVID crash and the fastest recovery on record. The S&P 500 finished up 18.3 percent despite a brutal spring. Technology led at plus 43.6 percent, consumer discretionary followed at plus 29.6 percent, and communication services added 26.9 percent, exactly the growth-heavy cyclicals you would expect to lead a sharp rebound. Energy, dragged down by oil briefly trading below zero, finished worst at minus 32.7 percent. One recovery year, and the ranking flipped almost perfectly opposite to a recession year.
Then 2022, the rate shock. The Federal Reserve raised rates at the fastest pace in decades, and the S&P 500 fell 18.2 percent. This is the year that punishes anyone who thinks technology always wins. Energy soared 64.3 percent, the best single-sector year in the whole grid, riding an oil spike. Communication services fell 37.6 percent, consumer discretionary fell 36.3 percent, and technology fell 27.7 percent, the three growth cyclicals all near the bottom because higher rates hammer the valuation of companies whose profits sit far in the future. The defensives held their ground again. Utilities gained 1.4 percent, consumer staples lost less than 1 percent, and health care lost 2.1 percent. A late-cycle, rising-rate year rewarded energy and the defensives and crushed the growth trade, close to what the framework would sketch.
The most recent complete year in the data, 2025, tells the plainer story of a healthy expansion. Technology led at plus 24.6 percent, communication services and industrials followed, and consumer staples brought up the rear at plus 1.5 percent while the S&P 500 returned 17.7 percent. Growth on top, defensives at the bottom, the ordinary shape of a good year.
Why the reshuffle is so hard to trade
Reading all of that, rotation sounds tradeable. Buy the cyclicals as the recovery starts, rotate to defensives as the cycle ages, and beat the index. The grid shows why that is far harder in practice than on a slide.
Start with persistence, or the lack of it. I measured what happened to each year’s best sector in the following year. Across the 26 year-over-year transitions in the data, the prior year’s winner repeated as the next year’s winner only 12 percent of the time. More telling, 62 percent of the time the prior year’s best sector fell into the bottom half of the pack the very next year. Chasing last year’s leader has been closer to a contrarian sell signal than a momentum buy. Technology led in 1999 at plus 65.1 percent, then finished worst for three straight years from 2000 through 2002 as the dot-com bubble unwound. That is the reshuffle in one sector’s row.
Now add the real problem, which is timing. The framework is stated in terms of cycle phases, early, mid, late, recession. Those phases are only labeled with confidence after the fact. The National Bureau of Economic Research, the body that officially dates US recessions, does not call a recession’s start until many months after it began, sometimes more than a year. You do not get a bell at the top telling you the late phase has arrived. You get noisy data, conflicting signals, and a leadership pattern that is real on average but scattered in any given year. To trade rotation you have to identify the current phase in real time, predict the next one, and act before the crowd, three hard problems stacked on top of each other, each with its own error.
The noise compounds the timing problem. Energy’s plus 64.3 percent in 2022 did not come from a tidy cycle read. It came from a war-driven oil spike that few forecast. A rotation model leaning on the business cycle would not have flagged energy as the year’s obvious winner. Real drivers, commodity shocks, a pandemic, a banking panic, cut across the smooth four-phase picture and reorder the grid in ways the framework does not anticipate. The pattern is a tendency measured over decades. It is not a schedule you can set a watch by.
The move that sidesteps the timing problem
There is a quieter option that removes every one of those hard problems at once. Owning the whole index means owning all eleven sectors at their market weights, and the rotation happens inside your portfolio automatically. When money flows from cyclicals to defensives, both sit in the same fund, so the shift nets out without a single trade, a tax event, or a phase call. The S&P 500 row along the bottom of the grid is what that looks like. It is never the best sector in any year and never the worst. It is the blend, and the blend compounded through every crash and recovery in the chart without once needing to guess which phase came next.
The spread inside a single year can top 40 percentage points between the best and worst sector, as 2008 and 2022 both show. That spread is the prize a perfect rotation would capture and the penalty an imperfect one pays. Given that last year’s leader lands in the bottom half of the pack 62 percent of the time, and given that the cycle’s turning points are clear only in the rearview mirror, the honest read is that rotation is far easier to narrate than to harvest. The pattern is real. Watch the grid and you will see defensives cushion the busts and cyclicals lead the booms, year after year. Acting on it in advance, correctly and repeatedly, is the part almost nobody does well, and the index quietly captures the whole cycle without asking you to try.