A new Audi A7 loses $40,702 of its value in five years. A new Honda Accord loses $8,654. Both figures come from the same study of the same used-car market, and the gap between them is larger than the price of the Accord.
That is the part of a car purchase nobody negotiates. Buyers spend hours on the monthly payment and the trade-in and the rate, and almost none on the number that dominates every one of them. Depreciation is the single largest cost of owning a new car, it is invisible until the day you sell, and it scales with the price tag in a way that is worth seeing in dollars before you sign anything.
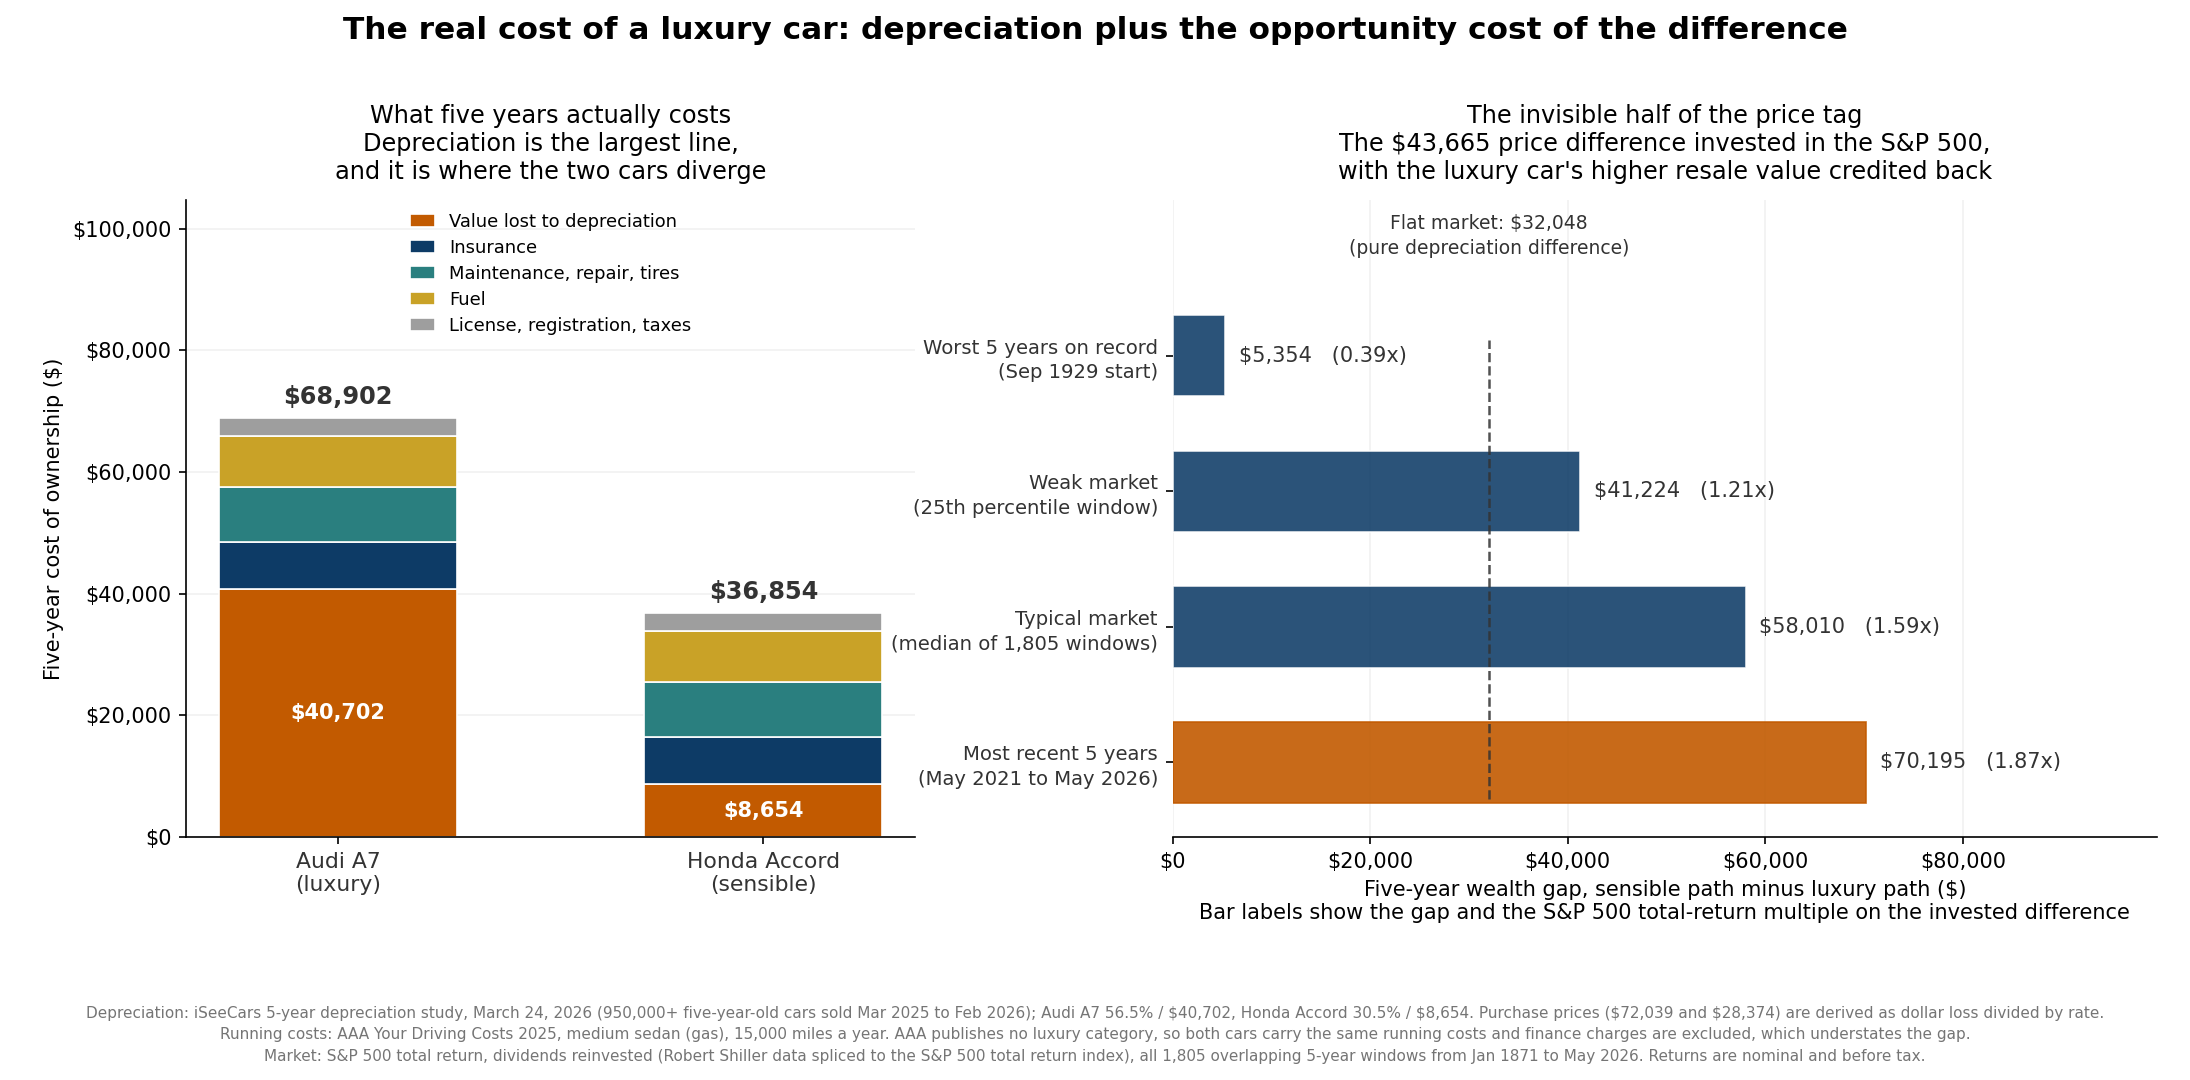
There is a second cost that is even quieter. When you spend $72,000 on a car instead of $28,000, the $44,000 difference does not vanish into the ether. It goes into the car, where it earns nothing and then decays. Had it gone somewhere else, it would have compounded. That forgone compounding is a real cost, and it is the one that separates a car decision from a car purchase. The chart below puts both costs side by side: the full five-year bill for each car on the left, and what the unspent difference would have become on the right.
Depreciation is a bill that arrives whether you look at it or not
In 2026, iSeeCars published its annual five-year depreciation study, built from the transaction prices of more than 950,000 five-year-old used cars sold in the year to 2026. The headline result is that the average vehicle lost 41.8 percent of its value over five years, which worked out to an average of $16,571 off the original price.
That average conceals an enormous spread, and the spread is the interesting part. Trucks were the strongest segment, giving up 34.2 percent. Hybrids were close behind at 35.4 percent. SUVs lost 44.9 percent. Electric vehicles lost 57.2 percent, an average of $28,435, which the study attributes to used buyers declining to pay the premium that new EV buyers paid. Luxury models sit at the wrong end of that distribution almost everywhere you look. Eighteen of the twenty-five worst-depreciating vehicles in the study are luxury models. Karl Brauer, the study’s author, put it directly: luxury vehicles offer upscale styling, premium materials, and the newest technology, and the used market simply does not put the same value on those traits.
The model-level numbers make the point sharper than any average can. The BMW 7 Series lost 61.6 percent of its value, which came to $61,141. The Land Rover Range Rover lost 61.7 percent, or $69,856. The Audi A8 L lost 57.6 percent, or $54,824. Compare those to the Toyota Tacoma at 19.9 percent and $6,426, or the Honda Civic at 22.9 percent and $5,828. A Range Rover buyer surrendered more value in five years than a Civic buyer spent on the entire car, twelve times over.
Percentage and dollars tell different stories at the two ends of the market, and the study is careful about this. The Nissan LEAF had the highest depreciation rate of any vehicle at 63.1 percent, and because its original price was modest, that translated to $17,743. The Range Rover depreciated slightly less in percentage terms and lost nearly four times as much money. When you are deciding what to buy, the dollar figure is the one that hits your net worth.
Luxury is not automatically a trap, which is worth saying because the pattern has exceptions and the exceptions are instructive. The Porsche 718 Cayman held its value better than any vehicle in the study, losing just 9.6 percent, or $6,988. The Porsche 911 lost 11.1 percent. The Mercedes-Benz G-Class was the best large SUV for value retention at 34.0 percent, beating every full-size American SUV in the segment. Scarcity and a durable enthusiast following can hold a price up. Volume luxury sedans and mainstream luxury SUVs have neither, and they depreciate accordingly.
For the comparison in the figure I picked two sedans from that study: the Audi A7, which lost 56.5 percent and $40,702, and the Honda Accord, which lost 30.5 percent and $8,654. The pairing is my choice, and I want to be explicit about that. What is not my choice is the arithmetic underneath it. Because iSeeCars publishes both the percentage and the average dollar loss for each model, the implied purchase price falls out of the data directly. Divide $40,702 by 0.565 and the A7 sits at about $72,039. Divide $8,654 by 0.305 and the Accord sits at about $28,374. Those prices are derived from the study, so the scenario is not built on a price I invented.
The running costs are the smaller half of the story
Since 1950, AAA has published an annual study called Your Driving Costs that measures what it actually takes to own a new car. The 2025 edition, released in September 2025, found that owning and operating a new vehicle cost $11,577 a year, a decrease of $719 from 2024, across a sample whose sales-weighted average MSRP was $38,938. AAA builds the number from five top-selling models in each of nine vehicle categories, assuming 15,000 miles a year over a five-year hold, or 75,000 miles in total.
The breakdown is where the study earns its keep. Averaged across the whole sample, depreciation ran $4,334 a year, the largest single line by a wide margin. Full-coverage insurance was $1,694 a year. Maintenance, repair, and tires came to 11.04 cents a mile. Fuel came to 13.00 cents a mile, with regular grade averaging $3.151 a gallon over the twelve months ending May 2025. License, registration, and taxes added $813 a year. Finance charges added $1,131 on a five-year loan with 15 percent down at the national average rate.
For a gasoline medium sedan specifically, which is the category an Accord falls into, AAA reports fuel at $1,669 a year, maintenance at $1,786, full-coverage insurance at $1,572, and license, registration, and taxes at $613. Those four lines total $5,640 a year, or $28,200 across five years.
Here is where I hit a wall that I am going to be honest about instead of papering over. AAA does not publish a luxury vehicle category. There is no AAA number for what it costs to insure, service, and register an Audi A7. I could guess. Everyone knows luxury insurance runs higher, luxury parts cost more, and value-based registration fees scale with the sticker. Guessing would let me print a bigger and more dramatic gap. So I did the opposite and applied the identical AAA medium-sedan running costs to both cars. I also excluded finance charges entirely and assumed both cars are bought with cash, which removes the interest a luxury buyer would more plausibly pay on a larger loan.
Both choices push the result in the same direction, and it is against my own argument. Every number that follows is a floor. The real gap is wider than what the chart shows, and I would rather understate it with sourced inputs than overstate it with plausible ones.
With running costs held equal, five years of ownership comes to $68,902 for the A7 and $36,854 for the Accord. That is the left panel of the figure. Depreciation is the tallest block in both bars, and it is the only block where the two cars differ. Everything else stacks up identically, which is exactly what makes the comparison clean.
The difference does not sit still
The $32,048 gap in ownership cost is the visible answer, and it is incomplete. It treats the two cars as though the only thing that happens over five years is that they lose value. Something else happens to the $43,665 you did not spend.
The fair way to run this is to follow total wealth on both paths. On the luxury path you pay $72,039 in cash and at year five you hold a car worth $31,337. On the sensible path you pay $28,374, hold a car worth $19,720 at year five, and have $43,665 invested from day one. Running costs are equal and cancel. The luxury car is genuinely worth $11,617 more as a used car, and that credit belongs to it, so it comes off the top of any gap I claim. A car is an asset with a bad return, and calling it a bonfire would be wrong.
For the market side I used the S&P 500 total return with dividends reinvested, drawn from Robert Shiller’s dataset spliced to the official total return index. There are 1,805 overlapping five-year windows in that record, running from January 1871 through 2026. Instead of picking one and calling it representative, the right panel of the figure shows four of them.
Start with the arithmetic floor. If the market had gone exactly nowhere over the five years, returning precisely zero, the wealth gap would be $32,048. That is the dashed line on the chart, and it is identical to the difference in depreciation, which is the sanity check that tells you the accounting is right. Nothing about the market is doing any work at that point.
Now let the market behave the way it has. In the median five-year window across 155 years, the S&P 500 returned 1.59 times your money, about 9.78 percent a year. That turns the $43,665 into $69,627, and after crediting the luxury car its higher resale value the gap lands at $58,010. In a distinctly weak market, the 25th-percentile window at 1.21 times, the gap is still $41,224. Over the most recent five years, May 2021 through 2026, the S&P 500 delivered 1.87 times, or 13.38 percent a year, and the gap reaches $70,195.
The left tail deserves its own sentence, because a fair analysis has to show you where its argument is weakest. In the single worst five-year window in the entire record, starting in September 1929, the market returned 0.39 times, meaning the invested difference lost 61 percent of its value. The gap shrinks to $5,354. It stays positive, which is the quiet structural point here, since the luxury car’s depreciation was so large that even a catastrophic market barely closed the distance. Across all 1,805 windows the market finished lower 10.3 percent of the time. Roughly one five-year stretch in ten, investing the difference would have made things worse before the depreciation gap made them better again.
What this analysis does not claim
The numbers above are averages drawn from large samples, and your specific car is not an average. The iSeeCars figures are model-level means across thousands of transactions, so trim, mileage, condition, color, and region all move an individual outcome. A carefully kept A7 with 40,000 miles will beat 56.5 percent. A thrashed one will not.
The comparison also holds miles and use constant. If the luxury car genuinely does a job the cheaper car cannot do, the comparison is measuring the wrong thing. A four-hour weekly commute in a quiet, comfortable car with excellent seats is a different product from the same commute in a compact sedan, and the difference in fatigue is real even though it does not appear in any study I can cite.
The market side carries the risk that always attaches to equities. The 9.78 percent median is what the record produced over a very long period. It is not a rate anyone owes you, and the 1929 window is in the dataset precisely because five years is a short horizon for stocks. Returns here are nominal and before tax, and a taxable brokerage account would give back some of the gain when you sell.
One more limitation cuts the other way. Buying used sidesteps most of this. The steepest part of the depreciation curve falls in the first year, and a buyer picking up a three-year-old luxury sedan inherits the car without absorbing the loss that the original owner already ate. Every number in this article describes a new-car purchase specifically.
Buying the car anyway, with the number in front of you
None of this is an argument against nice cars. Engineers buy nice cars, and it is a reasonable thing to do with money you earned. A car is one of the few purchases you touch every day for years, and there is nothing irrational about paying for something you use constantly and enjoy. Spending is what money is for.
The argument is about legibility. The typical framing of this decision is a monthly payment, which is the number most designed to obscure what is happening. A payment tells you what leaves your account. It says nothing about what the asset does while you own it, and nothing at all about what the money you committed would have done elsewhere.
The honest version has three parts, and only one of them appears on the window sticker. There is the price, which you negotiate. There is the depreciation, which you do not negotiate and which ran $40,702 on this particular car over five years. And there is the compounding you gave up on the difference, which in a typical market added roughly another $26,000 on top of the depreciation gap, arriving at $58,010 in total.
Fifty-eight thousand dollars over five years, or about $11,600 a year, is the real price of the upgrade under median market conditions. Stated that way it becomes a decision you can actually make. Some people will look at $11,600 a year and decide the car is worth it, which is a completely defensible conclusion and one I would not argue with. Others will look at the same number and realize they had been comparing a $980 payment to a $520 payment and thinking the gap was $460 a month.
The useful move is to run your own version before you shop. Look up the specific model in the iSeeCars data, take its five-year dollar loss, add the difference in purchase price compounded at a return you consider plausible, and subtract the resale value you will actually recover. It takes about ten minutes. You may buy exactly the same car you were going to buy. You will buy it knowing what it costs, which is a different transaction from buying it knowing what it is priced at.
Sources
- iSeeCars, “The Top 25 Cars That Hold Their Value Best and the 25 Worst,” five-year depreciation study published 2026, based on more than 950,000 five-year-old used cars sold from March 2025 through 2026. https://www.iseecars.com/cars-that-hold-their-value-study
- AAA, “Your Driving Costs” 2025, published September 2025, covering 45 models across nine vehicle categories at 15,000 miles a year over a five-year ownership period. https://newsroom.aaa.com/2025/09/aaa-new-vehicle-costs-drop-to-11577/
- Robert J. Shiller, online data for U.S. stock prices, dividends, earnings, and CPI, spliced to the S&P 500 total return index for the recent tail. http://www.econ.yale.edu/~shiller/data.htm