The Fed raised rates in seven separate campaigns since 1980, and the S&P 500 rose across every single one. The reflex says rates up, stocks down. The record says something more tangled, and understanding why starts with seeing that a rate hike is really four separate forces, each arriving on its own schedule.
I built this from two sources. The federal funds rate comes from the Federal Reserve’s FRED database (series FEDFUNDS), monthly, running from July 1954 through 2026. The S&P 500 comes from a monthly dataset that splices Robert Shiller’s long history onto the official S&P 500 total return and price indices, current through 2026. Together they let me measure the actual return an investor earned during each of the Fed’s modern tightening cycles, dividends reinvested, and set it against the story most people carry in their heads.
As of the 2026 monthly average, the federal funds rate stood at 3.63 percent, per the FRED FEDFUNDS series. That is a dated reading of a live instrument, and it will be a different number by the time you read this, so treat it as a snapshot.
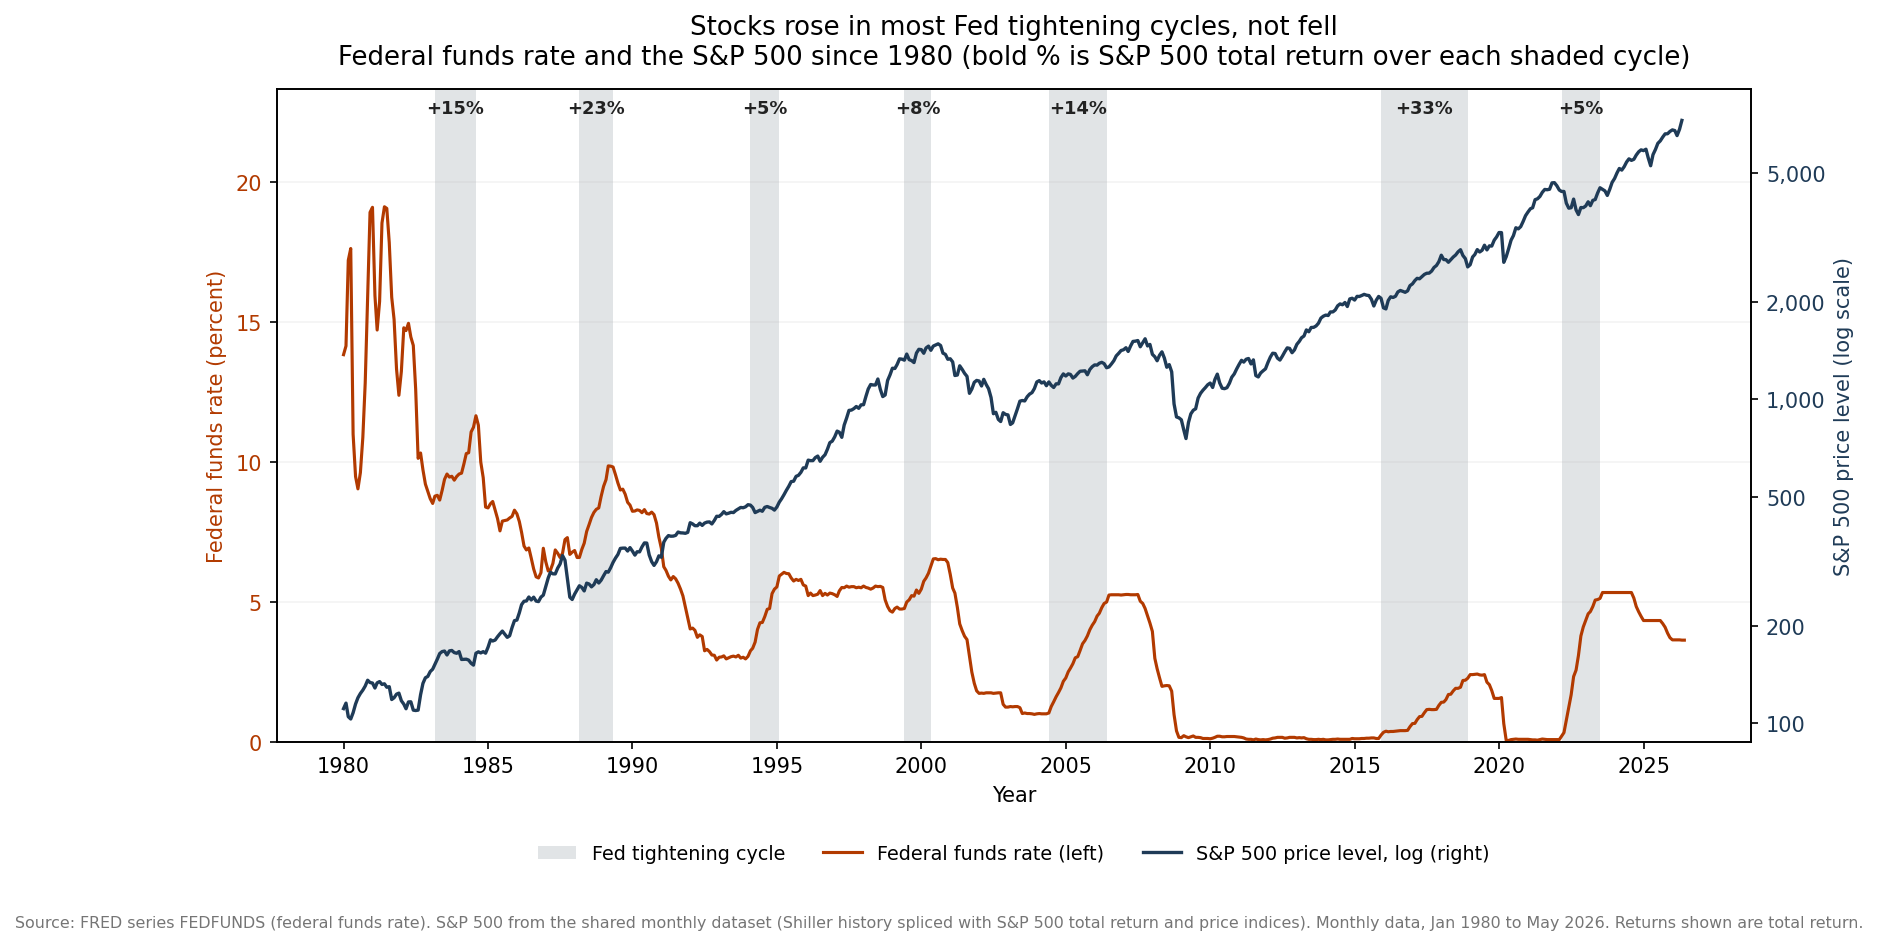
Here is that tangled record in one chart, the funds rate and the S&P 500 side by side since 1980 with each of the Fed’s seven tightening campaigns shaded.
The one line everyone repeats
“Rates up, stocks down” is the whole model for most people. It is not wrong so much as it is a single wire standing in for a control panel. The federal funds rate is the overnight rate banks charge each other, the one lever the Fed actually moves. Stock prices are an output far downstream of that lever, separated from it by earnings, discount rates, credit markets, and the spending decisions of a few hundred million consumers. A change in the rate does reach stock prices. It reaches them through several distinct paths at once, and those paths carry different signs, different strengths, and different lags.
An engineer would recognize the shape of the problem immediately. The policy rate is one input into a large system with many internal states, and the price of the S&P 500 is one output of that system. Between the input and the output sit multiple transfer functions, each with its own gain and its own phase delay. Push the input and the output moves, but the movement is the sum of several responses that peak at different times. Reading only the headline is like judging a multi-loop controller by watching one wire and assuming it explains the machine.
The chart above shows why the headline breaks down. It plots the federal funds rate on the left axis and the S&P 500 price level on the right axis, log scaled, from 1980 to 2026, with each of the seven modern tightening cycles shaded. The bold percentage above each shaded band is the S&P 500 total return over that cycle. Every one of those numbers is positive.
Four channels, four different machines
The first channel is the discount rate on future earnings. A stock is worth the present value of the cash it will produce, and present value means future dollars are marked down by a discount rate that rises when safe interest rates rise. The math is unforgiving on long horizons. One dollar of earnings ten years out is worth about 61 cents today at a 5 percent discount rate and about 46 cents at 8 percent, a drop of roughly a quarter from a three point move. Companies whose value sits mostly in profits far in the future, the high-growth names with long duration, take the hardest hit from this channel, because more of their worth lives in exactly the years the discount rate punishes most. This is the channel that makes speculative tech fall faster than utilities when the Fed turns hawkish.
The second channel is competition from bonds. When the Fed lifts the overnight rate, Treasury bills and money market funds start paying more, and every dollar in stocks now has a credible rival that carries far less risk. An investor who could earn almost nothing in cash had little reason to leave stocks. An investor who can earn 5 percent on a Treasury bill has a real choice, and at the margin some money moves. Analysts call the comparison the equity risk premium, the extra return stocks must offer over safe bonds to justify their risk. Higher safe yields compress that premium and make stocks relatively less attractive without anything changing inside the companies themselves.
The third channel is the cost of corporate borrowing. Companies run on debt, and higher policy rates raise the cost of new bonds and of any floating-rate loans already on the books. A firm that refinances maturing debt at a higher coupon pays more interest, which comes straight out of profit and compresses margins. The effect is uneven. A company with a fortress balance sheet and long-dated fixed-rate debt barely feels it, while a heavily leveraged firm rolling short-term debt feels it fast. This channel works slowly, because debt matures on a schedule and the higher cost phases in as old bonds are replaced.
The fourth channel is consumer spending. The federal funds rate ripples out to mortgage rates, auto loan rates, and credit card rates, and higher borrowing costs cool household demand. Fewer homes get bought, fewer cars get financed, and discretionary spending softens. That lands on corporate revenue, since a company selling to a cooling consumer books slower sales. This is the longest and least predictable channel, because it runs through the decisions of millions of households and shows up in earnings only after a lag of many months.
Four channels, and notice that they do not even agree on timing. The discount-rate channel and the bond-competition channel are fast, repricing within days as markets react. The borrowing-cost channel and the consumer-spending channel are slow, playing out over quarters. A single quarter-point hike sends all four signals into the system at once, and they arrive at the stock price spread across a year or more. That alone should warn you against expecting a clean same-day reaction.
What the record since 1980 actually shows
Here is where the simple story falls apart. I identified the seven major Fed tightening cycles since 1980, took each from its first hike to the month the rate peaked, and computed the S&P 500 total return over that window. The result is one-sided in a way the reflex does not predict.
In the 1983 to 1984 cycle the fed funds rate climbed from about 8.8 percent to 11.6 percent, a rise of 2.9 points, and the S&P 500 returned 15.2 percent total, per the FRED and S&P data. In the 1988 to 1989 cycle the rate went from about 6.6 percent to 9.8 percent, up 3.2 points, and stocks returned 22.9 percent. The 1994 to 1995 cycle, the one that famously wrecked the bond market, took the rate from about 3.3 percent to 5.9 percent and still delivered a 5.1 percent stock return. The 1999 to 2000 cycle paired a 1.5 point rate rise with an 8.4 percent stock return. The 2004 to 2006 cycle nearly quintupled the rate, from about 1.0 percent to 5.0 percent over two years, while stocks returned 14.5 percent.
The two most recent cycles tell the same story with a twist. From December 2015 to December 2018 the Fed raised the rate from near zero to about 2.3 percent, and the S&P 500 returned 32.6 percent total, the best of the seven. The 2022 to 2023 cycle was the most violent in the sample, lifting the rate from about 0.2 percent to 5.1 percent, a rise of almost 5 points, and even that campaign produced a positive 4.9 percent total return measured from the first hike in March 2022 to the rate peak in July 2023. The catch is visible in the figure, where the blue line plunges through 2022 before climbing back. The full-cycle number was positive, and an investor still lived through a deep drawdown inside the window. The cycle return hides the ride.
Seven cycles, seven positive total returns, per the FRED FEDFUNDS series and S&P 500 total returns. If rising rates mechanically pushed stocks down, this is not the record you would see. The four channels are all real, and yet the net effect on the index over each tightening campaign came out positive every time.
The reason is that the Fed does not raise rates in a vacuum. It raises them because the economy is running hot, which usually means earnings are growing, employment is strong, and demand is solid. That expansion pushes stocks up through the numerator of every valuation, the earnings themselves, even as higher rates push down through the discount-rate denominator. In most of these cycles the numerator won. Add that markets are forward-looking and price expected hikes long before they land, and a telegraphed, gradual tightening carries little surprise by the time it arrives. The channels are already discounted. What moves stocks is the gap between what the Fed does and what the market already expected, and a well-signaled hiking cycle keeps that gap small.
Why a long-term investor should not trade the Fed
Take the four channels and the seven-cycle record together and the practical lesson is sharp. The relationship between rates and stocks is not a fixed sign you can trade on. It is a mix of fast and slow forces whose net effect depends on why the Fed is moving, how much of the move was expected, and what earnings are doing at the same time. A rule as blunt as sell when the Fed hikes would have pulled you out of stocks at the start of all seven cycles in the figure, every one of which the index finished higher.
There is a control-theory reason this trade is a trap. By the time you observe the Fed’s action, the system has already begun responding, because markets price the expectation ahead of the event. You are never acting on the input. You are acting on a stale, already-discounted reading of it, trying to steer a system whose fastest loops have closed before your order fills. A trader betting on the Fed is fighting the two quick channels, discount rate and bond competition, which repriced days ago, while the two slow channels, borrowing cost and consumer spending, will not resolve for quarters. There is no clean moment to act on.
The durable move is the boring one. Long-term investors are compensated for holding risk across the full cycle, including the drawdown that cuts through the 2022 window in the chart above, and the seven positive cycle returns are the payment for sitting through exactly that discomfort. Watch the federal funds rate as a gauge of where the economy sits in its cycle, at 3.63 percent in the 2026 reading of the FRED series. Understand the four channels so the daily commentary stops sounding like noise. Then hold your allocation, because the record since 1980 says the reflex to trade every Fed move would have cost you the very gains the tightening cycles delivered.