One dollar bet on the US stock market’s premium over cash since 1926 grew to about 770 dollars. One dollar bet on the small-stock premium over that same near-century grew to four. Both are real, documented, factor premia from the same academic dataset, and the gap between them is the whole subject of this article.
I built every number here from the Kenneth R. French Data Library, the public archive maintained by Eugene Fama and Kenneth French at Dartmouth. Fama and French founded and shaped the modern study of these factors, and Fama shared the 2013 Nobel prize in economics for the underlying work on asset prices. It publishes three monthly files used here: the research three-factor file for the market, size, and value factors starting July 1926, the momentum file starting January 1927, and the five-factor file for the profitability factor starting July 1963. All three run through 2026. Every return is stated in percent per month, and each one compounds into the growth of a single dollar.
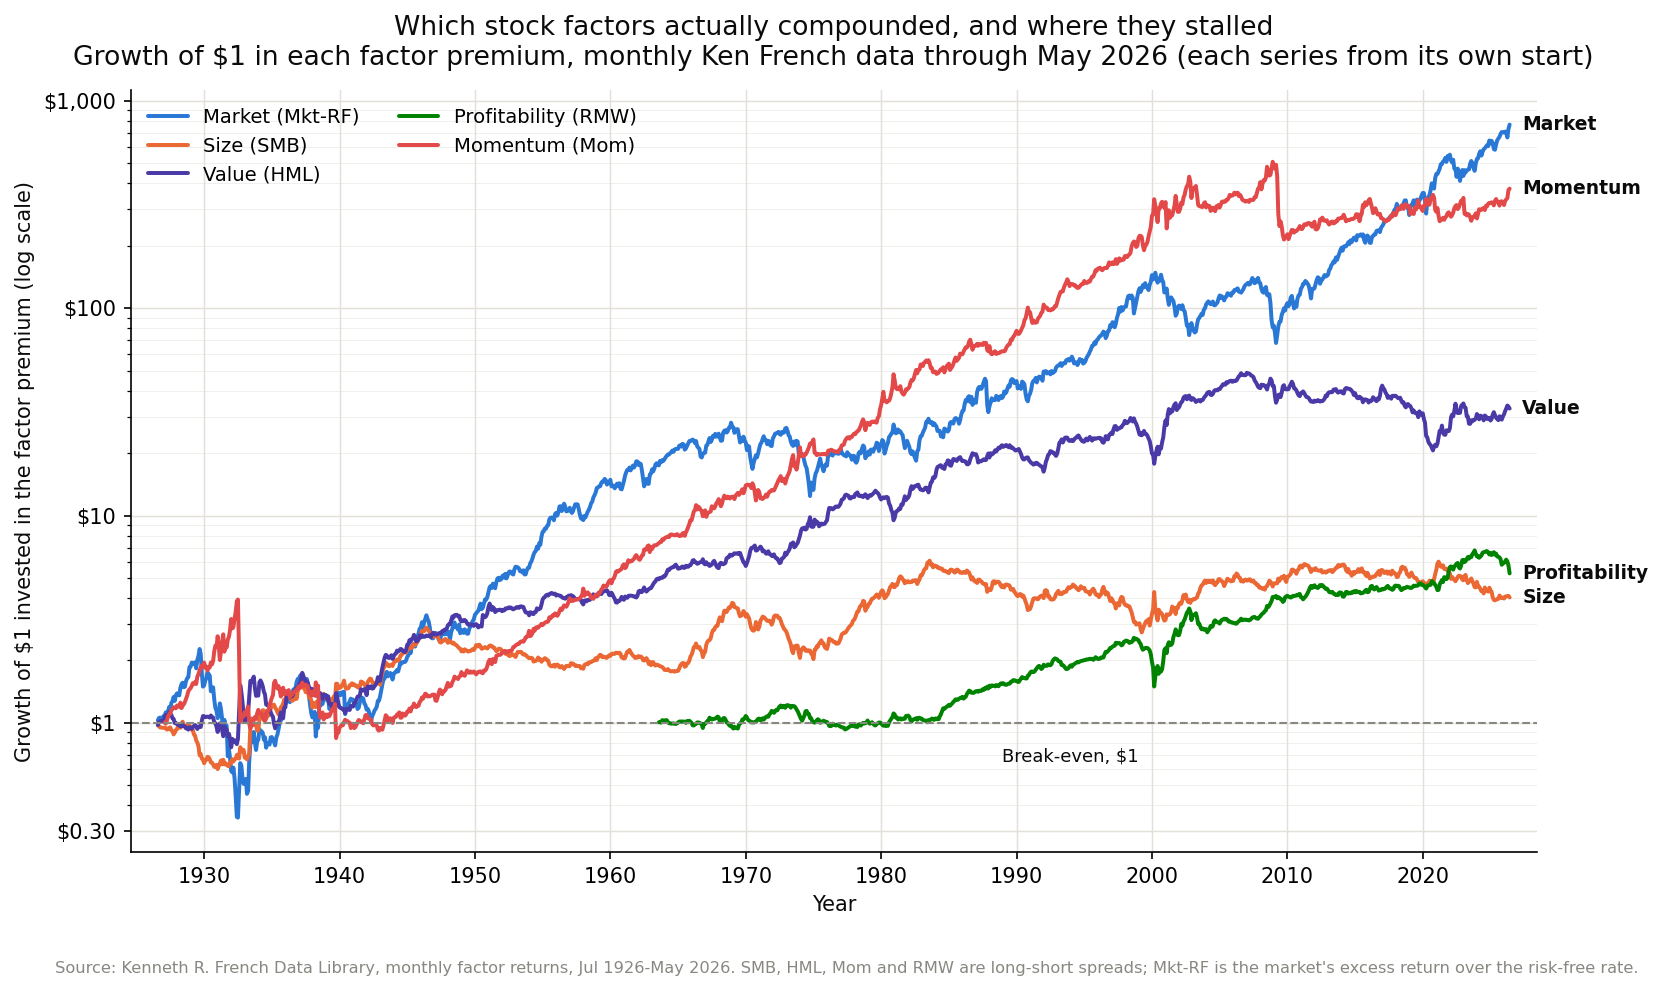
A factor is a measurable characteristic of a stock that has been paid a return premium over long periods. Cheapness is a factor. Small size is a factor. Recent price strength is a factor. High profitability is a factor. The claim of factor investing is narrow and testable. Sort stocks on one of these traits, hold the group the trait favors, short the group it disfavors, and the spread earned a positive average return across decades. The figure below plots the growth of one dollar in each of those spreads on a log scale, so you can see which of them compounded into real money and which of them flatlined.
The market factor is the baseline
Before any of the clever factors, there is the plain one. The market factor, written Mkt-RF in the French data, is the return of the entire US stock market minus the return on short-term Treasury bills. It measures what you were paid for holding stocks instead of parking cash. Economists call it the equity risk premium, and it is the reason a diversified index fund is a wealth machine over a working lifetime.
The size of that premium is large and it is the anchor for everything else. Over the July 1926 to 2026 window in the French data, the market factor compounded at 6.88 percent a year above the risk-free rate, with an arithmetic average of 8.36 percent a year. One dollar invested in that premium alone grew to about 770 dollars across the century. That is the blue line at the top of the figure, and it is the number every other factor has to justify itself against. A factor is only interesting if it added something on top of simply owning the market.
Think of the market factor as the base clock rate of the machine. Value, size, momentum, and profitability are proposed overclocks, small persistent edges layered on top of the baseline. The engineering question is whether each overclock is real, how large it is, and whether it still runs at the advertised speed today.
Four characteristics that paid a premium
The four style factors have different sizes, different birthdays in the data, and very different shapes on the chart.
Value is the oldest and most famous. Fama and French defined it in 1992 as the spread between cheap stocks and expensive ones, sorted on the ratio of book value to market price, and they labeled the factor HML for high minus low book-to-market. Cheap stocks, the high book-to-market group, beat expensive growth stocks on average for most of the twentieth century. In the July 1926 to 2026 French data, the value premium compounded at 3.56 percent a year, an arithmetic average of 4.22 percent, and one dollar in the value spread grew to about 33 dollars. That is the violet line, a strong upward march for sixty years that then goes sideways, and the sideways part is where the honesty of this article lives.
Size is the small-company premium, the factor labeled SMB for small minus big. Small stocks beat large ones on average, and the intuition is that smaller firms are riskier, less liquid, and more sensitive to the economy, so investors demanded extra return to hold them. The premium is real over the full record and it is the weakest of the four. In the same July 1926 to 2026 French data, the size premium compounded at just 1.40 percent a year, an arithmetic average of 1.97 percent, and one dollar in the size spread grew to only about four dollars over the century. That is the orange line, the one that barely climbs. Size is the cautionary factor, the one whose long-run payoff is thin enough that a few bad decades can erase most of the story.
Momentum is the strange one that keeps working. The momentum factor, labeled Mom, buys the stocks that went up the most over the past several months and shorts the ones that went down the most. There is no comforting risk story for why last year’s winners keep winning, which is exactly why it unsettles economists, and it has been one of the most powerful patterns in the data. Over the January 1927 to 2026 French momentum record, the momentum premium compounded at 6.15 percent a year, an arithmetic average of 7.48 percent, and one dollar in the momentum spread grew to about 378 dollars. That is the red line, running nearly as high as the market itself. Momentum also carries a warning that the smooth line hides. It crashes hard in sharp market reversals, and its 1932 and 2009 drawdowns were brutal, so the average premium came with occasional violent losses.
Profitability is the newest of the four and the cleanest in spirit. Fama and French added it to their model in 2015 as the factor RMW, robust minus weak, the spread between highly profitable firms and unprofitable ones measured by operating profitability. Profitable companies outearned unprofitable ones for the same price, which is close to what a careful investor would guess. The French RMW series begins in July 1963. Over July 1963 to 2026 it compounded at 2.67 percent a year, an arithmetic average of 2.95 percent, and one dollar in the profitability spread grew to about five dollars. That is the green line, a steadier climb than value or size and the factor that many practitioners now call quality.
Four traits, four premia, all positive over their full histories in the French data. The evidence really is multi-decade, and it is public, and anyone can rerun it. That is the strong version of the case.
The honest catch, dated
The weak version of the case is what happens when you zoom into the recent past, and it comes with dates so you can check whether it still holds.
The last stretch has not been kind to the two oldest factors. Over the fifteen years from June 2011 to 2026 in the French data, the size premium ran at negative 2.37 percent a year and the value premium at negative 0.85 percent a year, while the market factor compounded at 12.37 percent a year over the same window. Tighten it to the ten years from June 2016 to 2026 and the picture is the same, with size at negative 2.29 percent and value at negative 1.08 percent a year. For more than a decade, an investor tilting toward small and cheap stocks was paid nothing for it and often paid a penalty, while simply owning the whole market did beautifully. That is the flat and drooping right edge of the orange and violet lines in the figure.
Momentum and profitability held up better through the same recent window, which is the other half of the honesty. Over June 2011 to 2026 the momentum premium ran at a positive 2.72 percent a year and the profitability premium at a positive 1.62 percent a year in the French data, and over the trailing ten years they came in at 2.61 percent and 1.80 percent. Positive, useful, and far below what a fresh reader of the 1990s value literature would have expected the value premium alone to deliver. The lesson is uniform across all four. A premium that averaged several points a year over ninety years can go missing for ten or fifteen, and no factor is exempt from a long dry spell.
Why a known premium can shrink
There is a structural reason a documented factor can fade, and anyone thinking of acting on the data should understand it first.
A factor premium is not a law of physics. It is a price paid by some investors and collected by others, and once a source of extra return is published, measured, and turned into a cheap product that millions of people can buy, more capital chases it. That capital bids up the cheap stocks and the profitable stocks and the recent winners until the very cheapness or strength that defined the edge is smaller. Economists call this factor crowding, and it is a feedback loop. Discovery leads to money, money leads to buying, and buying compresses the spread the strategy was built to harvest. The signal that everyone can see and everyone trades is worth less than the signal only a few knew about.
An engineer will recognize the shape of this immediately. It is arbitrage acting as negative feedback on a control loop. A large enough error, an unpriced premium, attracts correcting flow, and the flow drives the error down toward zero. The value factor was documented in 1992, indexed into low-cost funds through the 2000s, and marketed heavily, and the fifteen years of flat-to-negative value premium in the French data since 2011 are at least partly consistent with a crowded trade whose easy edge got competed away. Whether that compression is permanent or just another long dry spell before a rebound is the open question, and the data cannot settle it in advance.
Crowding does not fall equally on every factor, which is one reason momentum is interesting. Momentum requires constant high-turnover trading to maintain, it is uncomfortable to hold through its crashes, and those frictions keep some capital out, which may be why its premium survived better in the recent French data than value’s did. A factor that is annoying and expensive to run is a factor that stays less crowded. The edges that persist tend to be the ones that hurt.
How to hold this as an engineer
The correct way to hold factor investing is the way a control engineer holds a model that is accurate on average and noisy in the moment. The four premia are genuine features of the historical data. The market factor grew a dollar to about 770 over the century, momentum to about 378, value to about 33, profitability to about five, and size to about four, all measured from the French library through 2026. Those magnitudes are not marketing, they are compounded arithmetic on public monthly returns.
What the same data forbids is treating any single factor as a switch that pays on a schedule. The premia arrive in decades, not quarters, they disappear for ten and fifteen year stretches that would exhaust most investors’ patience, and the act of everyone crowding into a published edge is itself a force that shrinks it. Respect the long-run evidence, size any tilt small enough that a lost decade will not break your plan, and keep the market factor as the load-bearing wall, because it is the premium with the deepest record and the widest diversification behind it. Read the factors as real and slow, distrust anyone who sells them as fast and certain, and the historical evidence becomes a tool you can actually use.