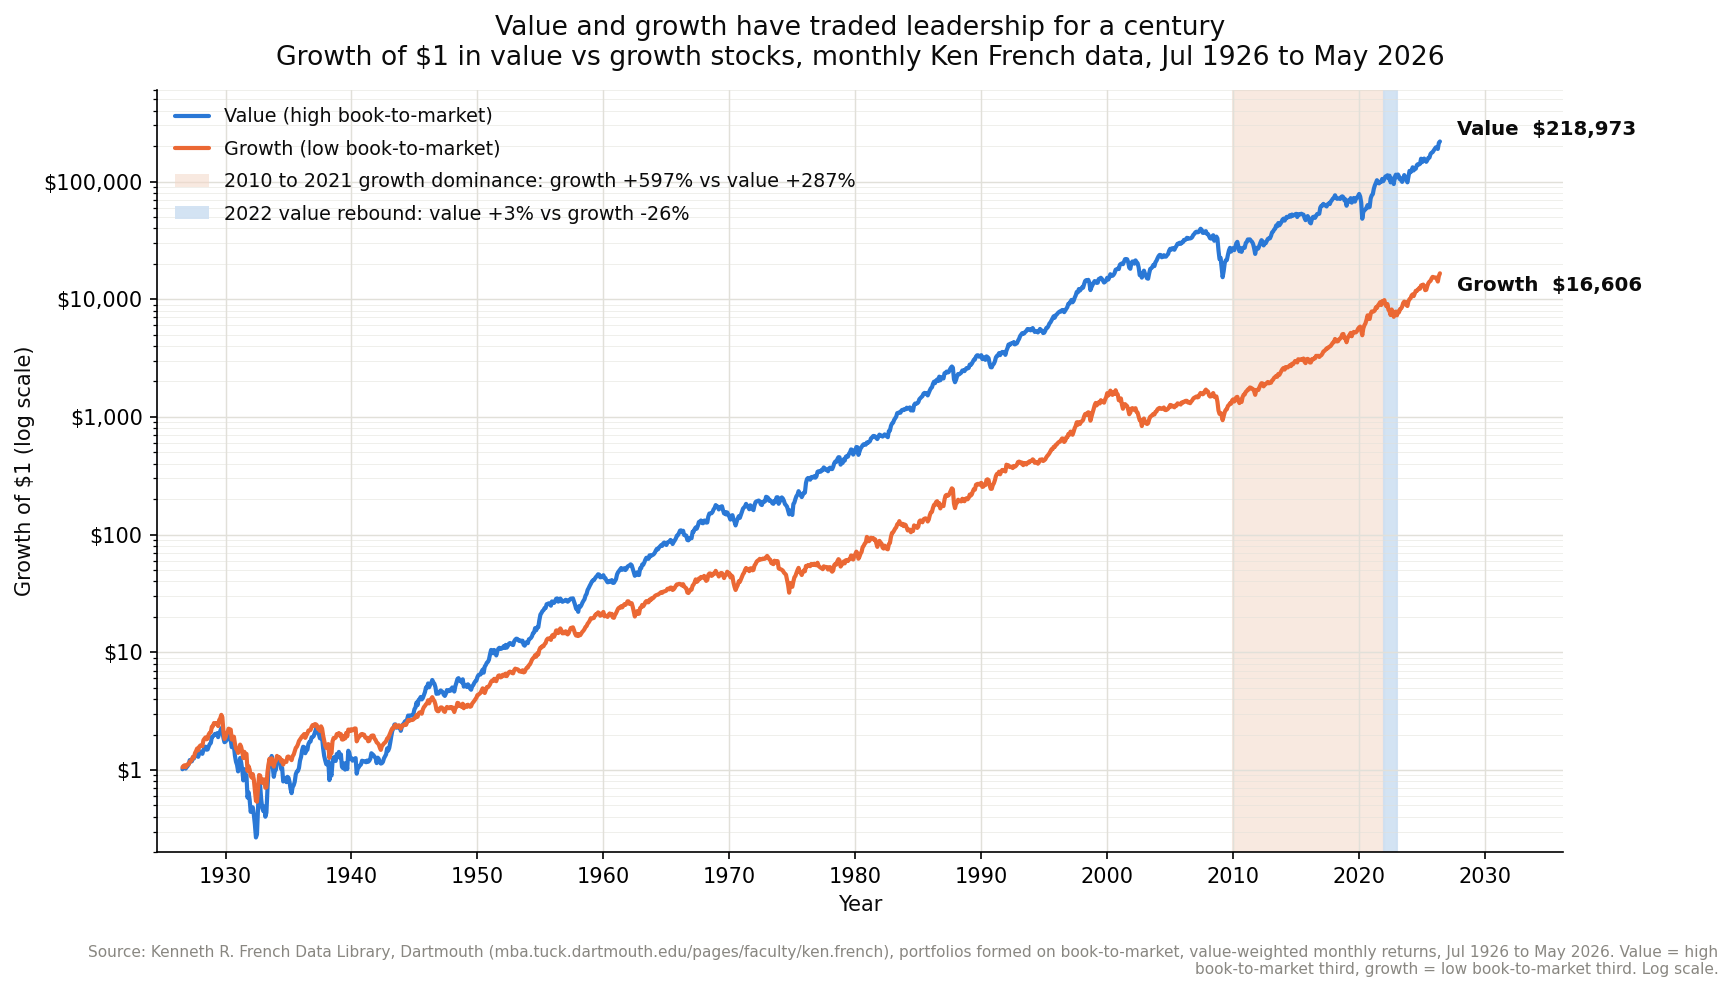
One dollar in cheap value stocks in July 1926 became about 219,000 dollars by 2026. The same dollar in expensive growth stocks became about 17,000. Value won the century by roughly 13 to 1, and almost nobody would have guessed that from the last fifteen years of headlines.
Every number here comes from the Kenneth R. French Data Library, the public archive maintained by Eugene Fama and Kenneth French at Dartmouth. It sorts the entire US stock market by book-to-market ratio and reports value-weighted returns for each group in percent per month. Value is the high book-to-market third of the market, the group French labels Hi 30. Growth is the low book-to-market third, labeled Lo 30. The series run from July 1926 to 2026, and each monthly return compounds into the growth of a single dollar.
The chart below plots those two dollars on a log scale across the full century, with the 2010 to 2021 growth-dominance stretch and the 2022 value reversal shaded. It shows a contest that keeps changing hands, and a long-run winner that spent the most recent chapter looking like a loser.
What value and growth actually mean
A stock is not value or growth by vibe. The label comes from a ratio, and the cleanest one is book-to-market, which divides a company’s accounting net worth by its stock-market value. A firm trading close to or below its book value has a high book-to-market ratio, and the market is pricing it cheaply relative to the assets on its balance sheet. A firm trading at many times its book value has a low book-to-market ratio, and the market is paying up because it expects earnings to grow fast for a long time.
That is the entire distinction. Value stocks are the ones the market has marked down, often because their business is boring, cyclical, or troubled. Growth stocks are the ones the market has marked up, because it believes their future cash flows will be large. Price-to-earnings and price-to-sales tell a similar story, and the French sort uses book-to-market because it is stable and computable back to the 1920s. The value premium is the historical tendency of the cheap group to beat the expensive group, and Fama and French made it famous in a 1992 paper that reshaped how finance thinks about returns.
An engineer can read the two groups as two different bets on a forecast. Value pays little for the future and asks to be surprised on the upside. Growth pays a lot for the future and needs that future to actually arrive. Which bet wins depends on how the future turns out and on how the market prices the waiting, and both of those move in cycles.
The century belongs to value
Stretch the lens all the way out and the argument looks settled. Over the July 1926 to 2026 window in the French data, the value portfolio compounded at 13.10 percent a year and the growth portfolio at 10.21 percent a year. That gap of just under three points a year sounds modest, and across a century it is enormous. One dollar in value grew to about 218,973, one dollar in growth grew to about 16,606, and the value dollar ended more than 13 times larger. Three points a year, compounded for ninety-nine years, is the difference between comfortable and staggering.
The blue value line in the figure sits above the orange growth line for most of the record. Value led through the mid-century decades, held its lead through the 1970s and 1980s, and stretched it to a peak in early 2007, when a dollar in value had grown to more than 25 times a dollar in growth by my reading of the same French data. For six decades the cheap-stock premium behaved close to the way the textbooks promised, and an investor who tilted toward value was rewarded for the discomfort of owning unloved companies.
This is the strong version of the value case, and it is real. It is public, it spans a near-century, and anyone can rerun it. The reason value earned a premium has two competing explanations that both survive. One is risk, that cheap firms are cheap because they are fragile, and the extra return compensates for the extra danger. The other is behavior, that investors overpay for exciting growth stories and underpay for dull ones, and the premium is the market slowly correcting its own enthusiasm. Whichever you believe, the compounded record through 2007 is not in dispute.
The decade that buried value
Then the line went the other way, hard. From January 2010 through December 2021 the growth portfolio returned about 596.6 percent in total, or 17.56 percent a year, while the value portfolio returned about 287.0 percent, or 11.94 percent a year, in the French data. Growth beat value by roughly 310 cumulative percentage points over those twelve years. That is the warm shaded band on the right of the figure, and it is the widest and longest stretch of growth dominance in the entire record.
The cause is not a mystery. The 2010s were a decade of near-zero interest rates and a handful of technology platforms that grew into the largest companies on earth. Cheap money and winner-take-most software rewarded exactly the expensive, fast-growing firms that define the growth group, and it punished the banks, energy producers, and industrial cyclicals that fill the value group. The value-over-growth ratio that peaked above 25 in early 2007 fell to about 10.7 by the end of 2021 in the French data, giving back more than half of a century’s accumulated edge in a little over a decade.
By 2020 the phrase “value is dead” was everywhere in financial writing, and the numbers gave it real support. A strategy that had trailed for that long stops looking like a temporary drought and starts looking like a broken model. This is the honest low point of the value story, and it is the part a century-long chart refuses to let you crop out. A premium that averaged three points a year for ninety years can go missing for twelve, and it can go missing precisely when the alternative is minting trillion-dollar winners.
Why rising rates hit growth hardest
The reversal, when it came, came through a single channel that every engineer who has discounted a cash flow will recognize. A stock is worth the present value of the cash it will return to shareholders, and present value depends on the discount rate you apply to future money. Growth stocks are long-duration assets, which means most of their value sits far in the future, in earnings the company has not yet produced. Value stocks are short-duration assets, with more of their worth in cash flows arriving soon.
Raise the discount rate and you punish the distant cash flows far more than the near ones, because compounding a higher rate over more years shrinks the present value more. A dollar expected in twenty years loses much more to a rate increase than a dollar expected next year. When the Federal Reserve lifted its policy rate off the floor through 2022 and the yield on long Treasuries jumped, the market repriced every long-duration asset downward, and growth stocks, whose whole appeal is the far future, took the worst of it.
The figure shows the result in the thin cool band at 2022. That year the value portfolio returned about 3.1 percent while the growth portfolio lost about 25.8 percent, so value beat growth by roughly 29 percentage points in a single year in the French data. Nothing about the underlying businesses changed that fast. What changed was the discount rate, and the discount rate is the lever that moves growth and value in opposite directions. Growth is rate-sensitive because its value lives far away in time, and 2022 was the year the market remembered that.
The contest is cyclical and not settled
Here is where both camps tend to overreach, and where the data ask for humility. The 2022 rebound was not the start of a permanent value regime. Extend the window to the latest month and the picture stays mixed. From January 2022 through 2026, value is still ahead, up about 107.8 percent against growth’s 69.0 percent, because 2022 dug growth such a deep hole. Start the clock one year later, from January 2023 through 2026, and growth leads again, up about 127.6 percent against value’s 101.5 percent, as the largest technology firms roared back on the strength of artificial intelligence spending. Same two portfolios, same French data, opposite conclusions depending on where you start the ruler.
That is the real lesson of the hundred-year chart. Leadership between value and growth trades back and forth on cycles measured in years and sometimes in whole decades, and any window short enough to feel current is short enough to mislead. The value-over-growth ratio in the French data has traveled from above 25 in 2007, down to about 10.7 at the end of 2021, and back up to roughly 13.2 by 2026. It oscillates. It does not resolve.
One durable fact sits underneath the noise. Growth’s long run through the 2010s left value trading at a wide discount to growth by historical standards, and a wide starting discount has, across the French record, tended to precede value’s better stretches and not its worse ones. That is an argument for owning some value, and it is not a timing signal. The cheap-stock premium can stay compressed for another decade before it snaps, and no one can tell you in advance which year the snap arrives, as the whiplash from 2022 to 2023 shows.
The way to treat this as an engineer is the way you treat any slow, noisy system with a real signal buried in it. The value premium is genuine over the century, worth almost three points a year and a 13-to-1 edge in ending wealth in the French data. It is also absent for stretches long enough to break most investors’ conviction, and it swings on interest rates and market mood in ways no one forecasts cleanly. Own both styles if you want the market’s full return, tilt toward value only with money you can leave alone through a lost decade, and distrust anyone who tells you the contest is over. A hundred years of data say it never is.