Your fund’s expense ratio is printed on every statement. The larger cost is not, and in a taxable account it can eat a quarter of your thirty-year balance while you never see a line item for it.
That cost is tax drag. It is the return you lose each year because the fund passes taxable income and realized gains through to you, and you owe tax on them whether or not you sell a single share. The expense ratio is money the fund company takes. Tax drag is money the tax authority takes on the fund’s behalf. Both come out of the same compounding engine, and the second one is usually the bigger of the two.
Most investors obsess over the first number and ignore the second. The expense ratio is easy to find, quoted to the hundredth of a percent, and compared across funds on every brokerage screen. Tax drag hides inside your April tax return, spread across a 1099 form, disconnected from the fund that caused it. Because it is hard to see, it is easy to underestimate, and it compounds exactly like a fee. This article measures it, names the mechanism that creates it, and shows the one structural fix that makes most of it disappear. Here is the damage up front: the same 10,000 dollars, compounded for thirty years, under annual drags running from zero to two full percentage points.
The fee that never shows up on a statement
Start with a definition, because tax drag gets confused with the tax you pay when you sell. Tax drag is the annual bite, the tax you owe every year on what the fund distributes to you along the way. A fund holding stocks collects dividends. A fund manager who sells a winning position realizes a capital gain. By law, a mutual fund must pass the bulk of that dividend income and net realized gain to shareholders each year as a distribution. You receive it, often automatically reinvested, and you owe tax on it that year even though you did nothing and sold nothing.
Morningstar built a clean way to measure this, and it is worth knowing by name. The tax cost ratio estimates how much of a fund’s annual return an investor in a top tax bracket loses to the taxes owed on its distributions. It is expressed like an expense ratio, in percent per year. That makes the comparison brutal and direct. A fund with a 0.30 percent expense ratio and a 1.00 percent tax cost ratio is charging you far more in taxes than in fees, and only one of those two numbers is advertised.
The magnitudes are the point. Morningstar’s published research on the tax cost ratio finds that broad, low-turnover index funds and exchange-traded funds typically surrender only a few tenths of a percent a year to taxes, while high-turnover actively managed funds can give up a full percentage point or more of annual return to the tax bill on their distributions. Vanguard’s research on tax efficiency reaches the same conclusion from the other direction, showing that minimizing turnover and the taxable events it triggers is one of the largest controllable factors in an investor’s after-tax result. Both are published estimates, and both point at the same culprit, which is how often the fund trades.
The key word is annual. This is not a one-time toll you pay when you cash out. It is a recurring leak, taken every year, from the very balance that is supposed to be compounding. A fee and a tax that both skim the same fraction off your return each year are mathematically identical in their damage. The only difference is that one arrives with a glossy disclosure and the other arrives with your tax software.
Why some funds hand you a bigger tax bill
The size of your tax drag is mostly a story about turnover, which is how much of the portfolio the manager buys and sells in a year. Every time a manager sells a position that has risen, the fund realizes a capital gain, and that gain gets distributed to shareholders and taxed. A fund that holds its positions for years realizes very few gains and distributes very little. A fund that trades aggressively realizes gains constantly and distributes them constantly. High turnover manufactures taxable events, and taxable events are what tax drag is made of.
This is the structural reason a broad index fund is tax-quiet. An index fund only sells when the index itself changes its membership, which is rare, so it realizes gains slowly and hands you a small distribution. An actively managed fund chasing performance may turn over a large share of its holdings every year, and each of those trades that locks in a profit becomes a taxable distribution you did not ask for. Same market, same gross return on paper, wildly different tax bill.
Exchange-traded funds add a second layer of defense that ordinary mutual funds lack, and it is worth understanding because it explains why ETFs are so tax-quiet. An ETF does not usually sell securities to meet redemptions. It uses a mechanism called in-kind creation and redemption, where large institutional participants exchange baskets of the underlying stocks for ETF shares and back again. Because the fund can hand out appreciated shares in kind instead of selling them, it can satisfy outflows and even flush out its lowest-cost-basis holdings without realizing a taxable gain inside the fund. The result is that a broad-market ETF can go years distributing almost no capital gains at all, which is why so many of them post a tax cost ratio close to zero. That mechanism is the single biggest reason the tax cost of an index ETF sits at the low end of the range Morningstar reports.
One clarification matters here so the mechanism is not oversold. Tax drag lives in taxable brokerage accounts. Inside a tax-sheltered account, a traditional retirement account where growth is tax-deferred or a Roth account where qualified growth is tax-free, the fund’s distributions are not taxed as they happen, so the drag is zero regardless of how much the fund trades. That single fact is the entire basis for the fix at the end of this article. Turnover only costs you where the tax collector can reach the distributions each year.
What a percentage point does over thirty years
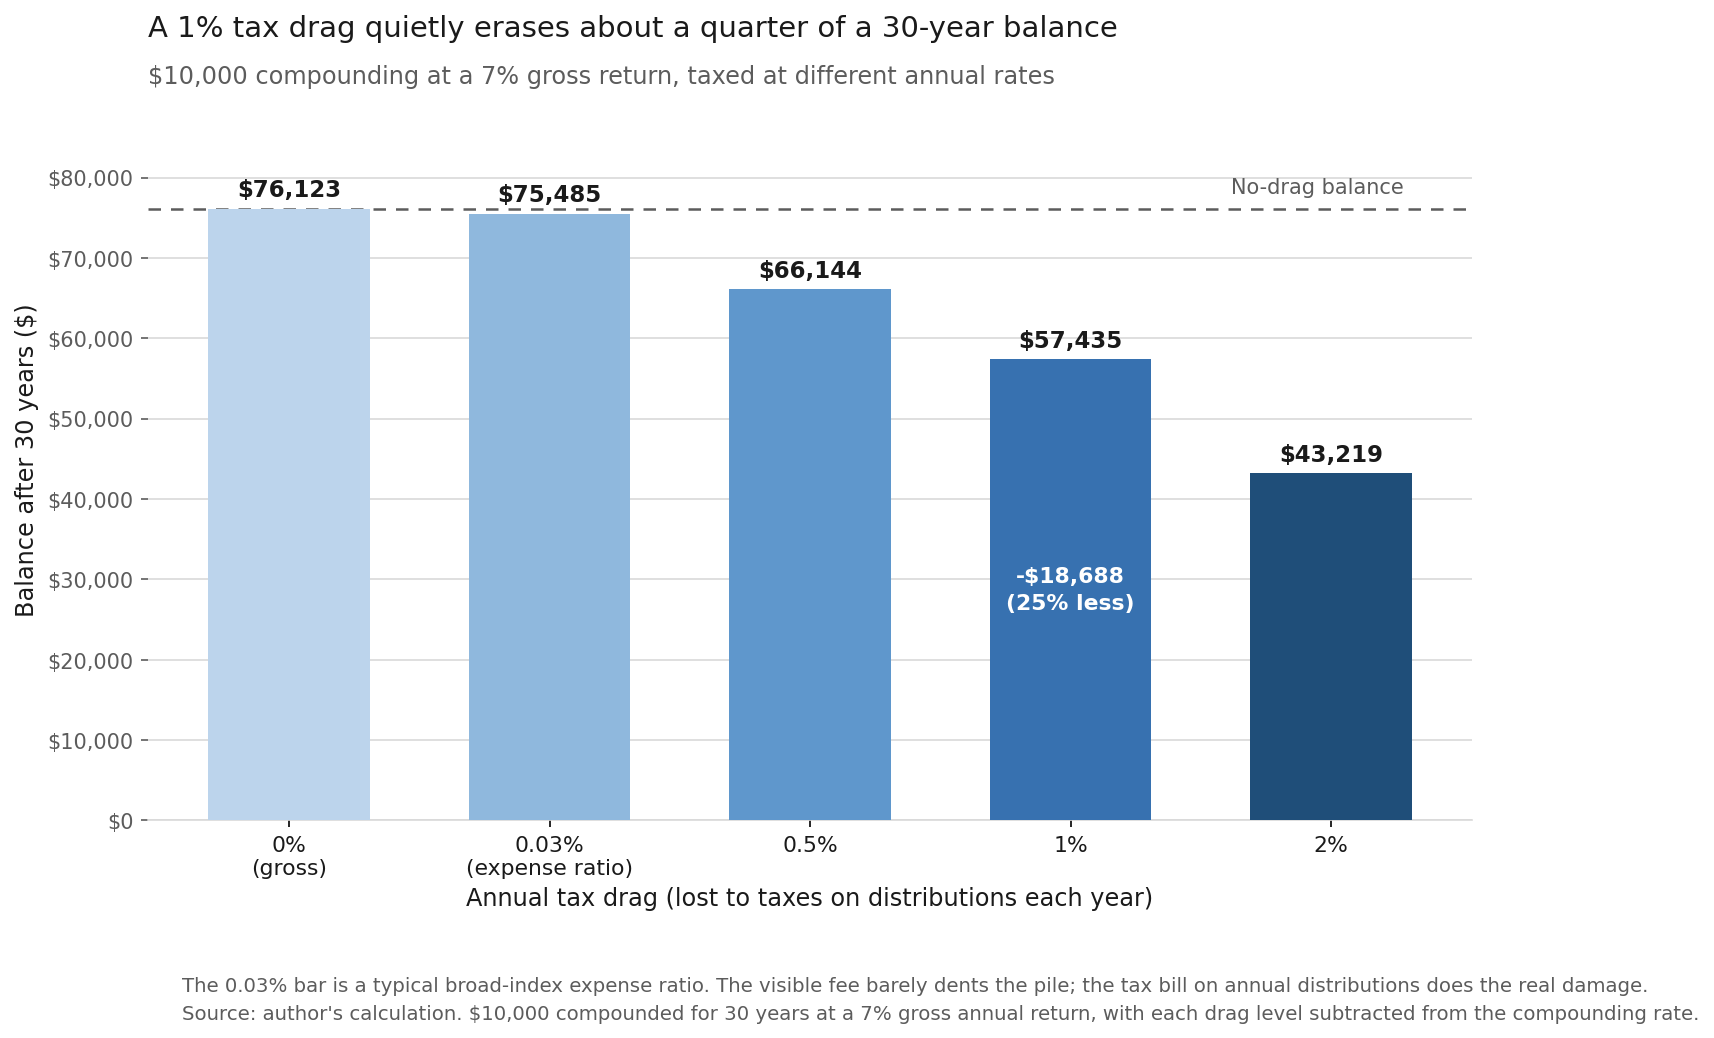
Numbers make this concrete, and the arithmetic is closed-form, so the chart above computes every value exactly with no market assumptions beyond a steady gross return. Take 10,000 dollars, let it grow at a 7 percent gross return for 30 years, and change only one thing: the annual tax drag that lowers the rate at which the money actually compounds. A 1 percent drag means the balance grows at 6 percent net instead of 7 percent. That is the whole model, and it is enough to show the damage.
The chart plots the thirty-year balance under four levels of annual drag and a fifth reference bar for a typical index-fund expense ratio. Read left to right and the pile shrinks as the tax bite grows.
With zero drag, the 10,000 dollars grows to 76,122.55 dollars. That is the full-power result, what you keep if none of the annual gain leaks to taxes. Now add the drag.
A 0.03 percent annual cost, the level of a typical broad-market index fund’s expense ratio, brings the balance to 75,484.86 dollars. The visible fee cost 637.69 dollars over thirty years, about 0.84 percent of the final pile. That is the number the industry has trained everyone to scrutinize, and it is real, but look at how small it is against what comes next.
A 0.5 percent annual tax drag, a plausible number for a middling tax-managed fund, drops the balance to 66,143.66 dollars. That is 9,978.89 dollars gone, about 13 percent of the no-drag result. Already the tax leak is more than fifteen times the size of the expense ratio’s damage.
A 1 percent annual tax drag, the level Morningstar’s research associates with a high-turnover active fund in a taxable account, brings the balance down to 57,434.91 dollars. The shortfall is 18,687.64 dollars, which is 24.55 percent of what the money would otherwise have become. One percentage point a year, quietly, erased about a quarter of a thirty-year balance. That single bar is the whole thesis of this article. The tax you never budgeted for did roughly twenty-nine times the damage of the expense ratio you agonized over.
A 2 percent annual drag, which a very tax-inefficient fund throwing off short-term gains can approach for a high-bracket investor, cuts the balance to 43,219.42 dollars. That is 32,903.13 dollars gone, 43 percent of the no-drag result, close to half the wealth vaporized by a cost that never appeared on a statement.
Stand the two costs side by side and the imbalance is almost absurd. The expense ratio you can quote from memory cost 637.69 dollars. The tax drag you probably never measured cost 18,687.64 dollars at the 1 percent level and more than 30,000 dollars at the 2 percent level, on the same 10,000 dollar starting stake. The reason the small number gets all the attention and the large number gets none is simply that the small one is printed and the large one is not.
Where to put the tax-hungry funds
The fix is not to abandon active funds or to fear dividends. The fix is location. Because tax drag only exists in a taxable account, you can neutralize most of it by choosing which account holds which fund. This is the idea professionals call asset location, and it is distinct from asset allocation. Allocation decides what you own. Location decides which account each holding sits in, and it can add after-tax return without changing your risk one bit.
The rule follows directly from the mechanism. Put the tax-inefficient, high-distribution holdings, the high-turnover active funds, the funds throwing off large taxable income, inside your tax-sheltered accounts, the traditional and Roth retirement accounts where annual distributions are shielded from tax as they happen. Put the tax-efficient holdings, broad index funds and ETFs that distribute almost nothing, in the taxable brokerage account where their small drag barely registers. You have not sold anything or changed your allocation. You have only moved each fund to the account where its tax behavior does the least harm, and the thirty-year arithmetic above is exactly how much that move is worth.
There is a floor on how far location can take you, and it is worth stating plainly so the strategy is used honestly. Sheltered accounts have contribution limits, so a large portfolio will spill its tax-inefficient funds into taxable space no matter how carefully you plan. When that happens, the second lever is selection, favoring the low-turnover index funds and ETFs whose creation-and-redemption plumbing keeps their tax cost ratio near the bottom of the range Morningstar reports. Location first, then selection, handles the overwhelming majority of the drag for most investors.
Before you buy any fund for a taxable account, look up its tax cost ratio the same way you look up its expense ratio, and add the two together. That sum is the honest annual cost of owning it outside a shelter. A fund with a tiny expense ratio and a large tax cost ratio is an expensive fund wearing a cheap price tag, and the chart above is what that price tag actually buys you over a lifetime of compounding. The expense ratio was never the fee to fear. The invisible one was.