In 2022 the 60/40 portfolio lost about 17 percent as stocks and bonds fell together, and a wave of headlines declared the strategy dead. The obituary was premature. When I rebuild the 60/40 portfolio month by month from January 1928 to 2026, using S&P 500 total return for the stock sleeve and a 10-year Treasury total return for the bond sleeve, the classic mix returns 8.41 percent a year with 11.49 percent annualized volatility. Holding 100 percent stocks over the same 98 years returned 10.24 percent a year but at 18.51 percent volatility. That is the whole bargain in two numbers. You give up 1.83 percentage points of annual return and you cut the size of your swings by 38 percent. Both numbers are my calculations from the data described below.
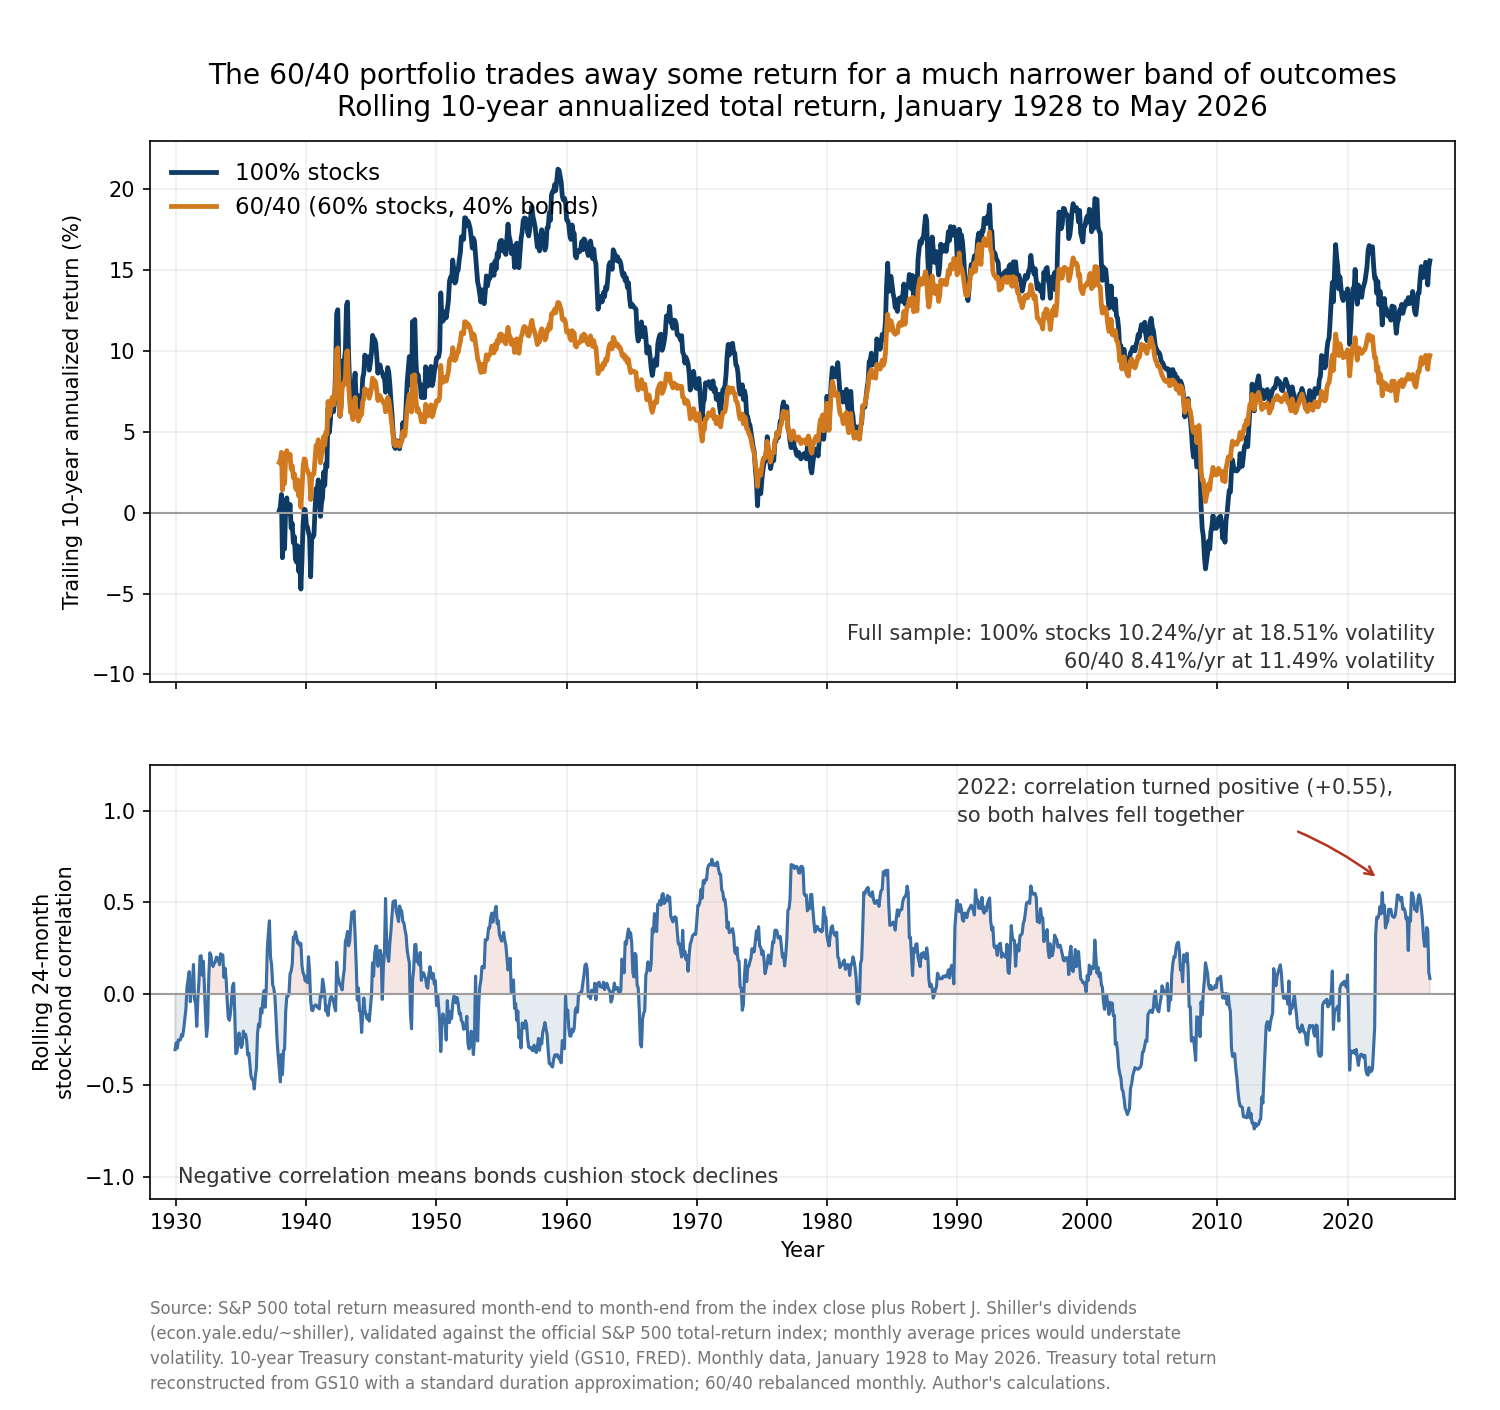
The 2022 experience felt like the machine breaking. It was closer to a stress test the design passes rarely but survives. This article rebuilds the portfolio from a century of monthly data, shows exactly what the bond sleeve is for, explains why 2022 was so unusual, and gives a straight answer on who should still own the mix today. Here is the reconstruction itself, with rolling 10-year returns for both mixes in the top panel and the stock-bond correlation in the bottom.
What 60/40 Is and Why the Bond Sleeve Exists
A 60/40 portfolio holds 60 percent of its money in stocks and 40 percent in bonds, and rebalances back to that split periodically. In my reconstruction the stock sleeve is the S&P 500 with dividends reinvested, and the bond sleeve is a constant-maturity 10-year US Treasury position, rebalanced monthly. The stock sleeve is the growth engine. The bond sleeve is the shock absorber.
The reason to hold bonds at all comes down to how they behave when stocks fall. A Treasury bond is a contract to pay fixed coupons and return your principal at maturity. Its price moves inversely to interest rates. When the economy weakens and stocks sell off, investors often expect the Federal Reserve to cut rates and they buy safe government bonds, which pushes bond prices up. So in a typical recession the stock sleeve drops while the bond sleeve rises or holds steady. Bonds zig when stocks zag. That offsetting motion is the entire engineering rationale for the 40.
The measure of that offset is correlation, a number from -1 to +1 that says how two things move relative to each other. A correlation of +1 means they rise and fall in lockstep, -1 means they move in perfect opposition, and 0 means their movements are unrelated. Over the full 1928 to 2026 sample the monthly correlation between my stock and bond returns is +0.085, close enough to zero to be worth almost nothing as a forecast. Averaged across a century, stock and bond returns have almost nothing to do with each other, and for long stretches the relationship turns firmly negative. That near-zero-to-negative correlation is what lets a blended portfolio have less risk than the weighted average of its parts. When one sleeve zigs and the other zags, the combined path is smoother than either alone.
This is the same idea a control engineer uses when damping a system. You do not remove the disturbance, you add a component whose response counteracts it, so the output oscillates less. The bond sleeve is a passive damper on an equity portfolio. It costs you some forward speed, measured here as 1.83 points of annual return, and in exchange the system stops overshooting so violently in both directions.
The Bargain, Measured Over a Century
The trade shows up clearly in the top panel of the figure. That panel plots the trailing 10-year annualized return of 100 percent stocks against the same for 60/40, rolled monthly from 1928 to 2026. Two features jump out. First, the stock line sits above the 60/40 line most of the time, which is the return you give up for holding bonds. Second, and more important, the 60/40 line lives in a much narrower band. Its best 10-year stretches top out well below the equity peaks, and its worst stretches never sink as low. The equity-only line spent the decade ending in the late 1930s and the decade ending around 2009 near or below zero. The 60/40 line barely dipped negative in those same windows.
The full-sample statistics quantify the narrowing. Stocks alone ran at 18.51 percent annualized volatility, the bond sleeve at 5.42 percent, and the blend at 11.49 percent, all from the monthly series in this article. A 60/40 investor experienced roughly 38 percent less variation in returns than a pure stock investor. Volatility is not an abstraction. It is the depth of the hole you have to sit in during a crash without selling, and it is the range of outcomes you face if you need the money on a fixed date. Cutting it by more than a third changes how a real person behaves when the screen is red.
The cost of that smoothing was real and worth naming precisely. Compounded over 98 years, the 1.83-point annual gap is enormous in dollar terms, because compounding rewards the higher rate exponentially. A dollar growing at 10.24 percent for a century becomes far more than a dollar growing at 8.41 percent. The 60/40 investor is explicitly buying a calmer ride and paying for it in terminal wealth. For someone with a 40-year horizon and the temperament to ignore drawdowns, that is a bad trade. For someone who will spend the money in 10 years, or who panic-sold in 2008 and locked in the loss, the calmer ride is often what keeps them invested at all, and staying invested beats the theoretically optimal portfolio you abandon at the bottom.
Why 2022 Broke the Pattern
Now to the year that prompted the death notices. In 2022 my reconstructed 60/40 fell 16.69 percent. The stock sleeve fell 18.16 percent and the bond sleeve fell 15.47 percent. The bonds, the supposed shock absorber, fell nearly as hard as the stocks. The damper became a second source of loss. That is why the year felt like a betrayal of the whole idea.
The cause was inflation, and the mechanism runs straight through the bond sleeve’s interest-rate sensitivity. Bond prices fall when yields rise, and the size of that fall is governed by duration. Duration is the approximate percentage change in a bond’s price for a one percentage point change in its yield. A 10-year Treasury at a 4 percent yield has a modified duration of about 8.1 in my calculation, meaning a one-point rise in yields knocks roughly 8 percent off its price. In 2022, US inflation ran near a four-decade high, and the Federal Reserve raised rates aggressively to fight it. The 10-year Treasury yield climbed from 1.47 percent at the end of 2021 to 3.62 percent at the end of 2022, a jump of more than two percentage points. Multiply a two-point yield move by a duration near 8 and you get a high-teens price loss, offset only slightly by coupon income. The bond sleeve did exactly what the math says a long-duration bond must do when yields spike.
The deeper point is about correlation. Bonds normally cushion stocks because the usual threat to stocks is recession, and recession pushes yields down, which lifts bond prices. In 2022 the threat was different. High inflation hurt both assets through the same channel, rising interest rates. Higher rates cut the present value of a company’s future earnings, so stocks fell, and higher rates directly repriced bonds lower, so bonds fell too. When the shared shock is inflation, the two sleeves stop offsetting and start moving together. The bottom panel of the figure shows this as the rolling 24-month stock-bond correlation, which spent most of the 2000s and 2010s deeply negative and then flipped sharply positive, peaking at +0.55 in late 2022. That flip, not the raw size of the loss, is the real 2022 story. The damper briefly reversed sign.
A Rare Event, Not a Dead Idea
Here is the part the obituaries skipped. A year where both stocks and bonds fall together is rare, and 2022 was not even close to the worst year the 60/40 portfolio has ever had. Ranking all 98 complete calendar years in my sample, 2022 comes in as the fourth worst for 60/40, at -16.69 percent. Three years were worse: 1931 at -26.51 percent, 1937 at -21.19 percent, and 2008 at -18.07 percent, with 1974 just behind at -15.51 percent. The strategy has taken bigger hits and recovered every time. Anyone who told you 2022 was the worst year for balanced portfolios in a century was not looking at the century.
What made 2022 distinctive was the simultaneity. Counting only full calendar years since 1928, both the stock sleeve and the bond sleeve finished down in the same year on just four occasions: 1941, 1969, 2018, and 2022. Four years out of 98, roughly one year in twenty-five. The offsetting behavior that justifies holding bonds holds in the large majority of years. When it fails, it tends to fail during inflation shocks, because inflation is the one macro force that pushes stock and bond prices the same direction at once. That is a known limitation of the design, not evidence the design is broken.
Notice also what the reconstruction shows after 2022. The rolling correlation in the bottom panel has already drifted back toward zero and turned negative again by the end of the sample in 2026, and the bond sleeve now starts from a 10-year yield near 3.84 percent instead of the 1.47 percent it began 2022 with. A higher starting yield matters twice over. It means more coupon income going forward, and it means the sleeve has more room to rally if the next crisis is a recession that pulls yields down. The 60/40 portfolio arguably enters the mid-2020s in better shape than it was in when the death notices were written, precisely because the 2022 repricing raised the return the bond sleeve now offers.
Who 60/40 Actually Suits
The honest verdict is that 60/40 is neither dead nor universal. It is a specific tool with a specific job, which is to deliver most of the equity market’s long-run return while cutting the volatility and the drawdowns by a large margin. The century of data says it does that job well, with one recurring failure mode during inflation shocks that investors should understand before they buy in.
A young investor with 30 or more years until they need the money, and the discipline to hold through a 50 percent equity crash without selling, is likely better served by a heavier stock allocation, because the 1.83-point annual return gap compounds into a very large sum over that horizon. The people 60/40 genuinely fits are those approaching or in retirement, those who will spend the money within roughly a decade, and those who know from experience that they cannot emotionally tolerate a pure-equity drawdown. For them the smoother path is not a luxury. It is the thing that keeps them from selling at the bottom and turning a paper loss into a permanent one.
The 2022 lesson is worth keeping, though. The bond sleeve protects you against recession risk, not against inflation risk. If you are worried specifically about inflation, plain nominal Treasuries are the wrong hedge, and investors with that concern should look at inflation-protected bonds, real assets, or a shorter-duration bond sleeve that is less exposed to the exact rate spike that defined 2022. The classic 60/40 mix is a well-engineered default for the risk it was built to handle. Knowing the one risk it does not handle is what turns it from a slogan into a decision you can actually stand behind.