Leave a 60/40 portfolio alone for 46 years and it stops being a 60/40 portfolio. It quietly becomes a 95 percent stock portfolio, carrying far more risk than the mix you chose on day one. That drift, and the small chore that undoes it, is one of the most argued-over and most misunderstood habits in investing.
The chore is rebalancing. It means periodically selling a little of whatever has grown and buying a little of whatever has lagged, to return the portfolio to its target mix. If your plan is 60 percent stocks and 40 percent bonds, and a strong year for stocks pushes you to 68/32, rebalancing sells enough stock and buys enough bond to put you back at 60/40. The standard advice is to do it once a year, and a small industry of blog posts argues over whether quarterly, monthly, or a drift-based trigger does better.
I ran the three main schedules on real S&P 500 and Treasury data from January 1980 through 2026. The headline is almost anticlimactic. The exact schedule barely matters. What rebalancing actually does is control risk, and in a taxable account the cost worth watching is taxes, not effort. Here is the full 46-year run, all three schedules on one chart, with the untouched portfolio’s drifting stock weight tracked in the bottom panel.
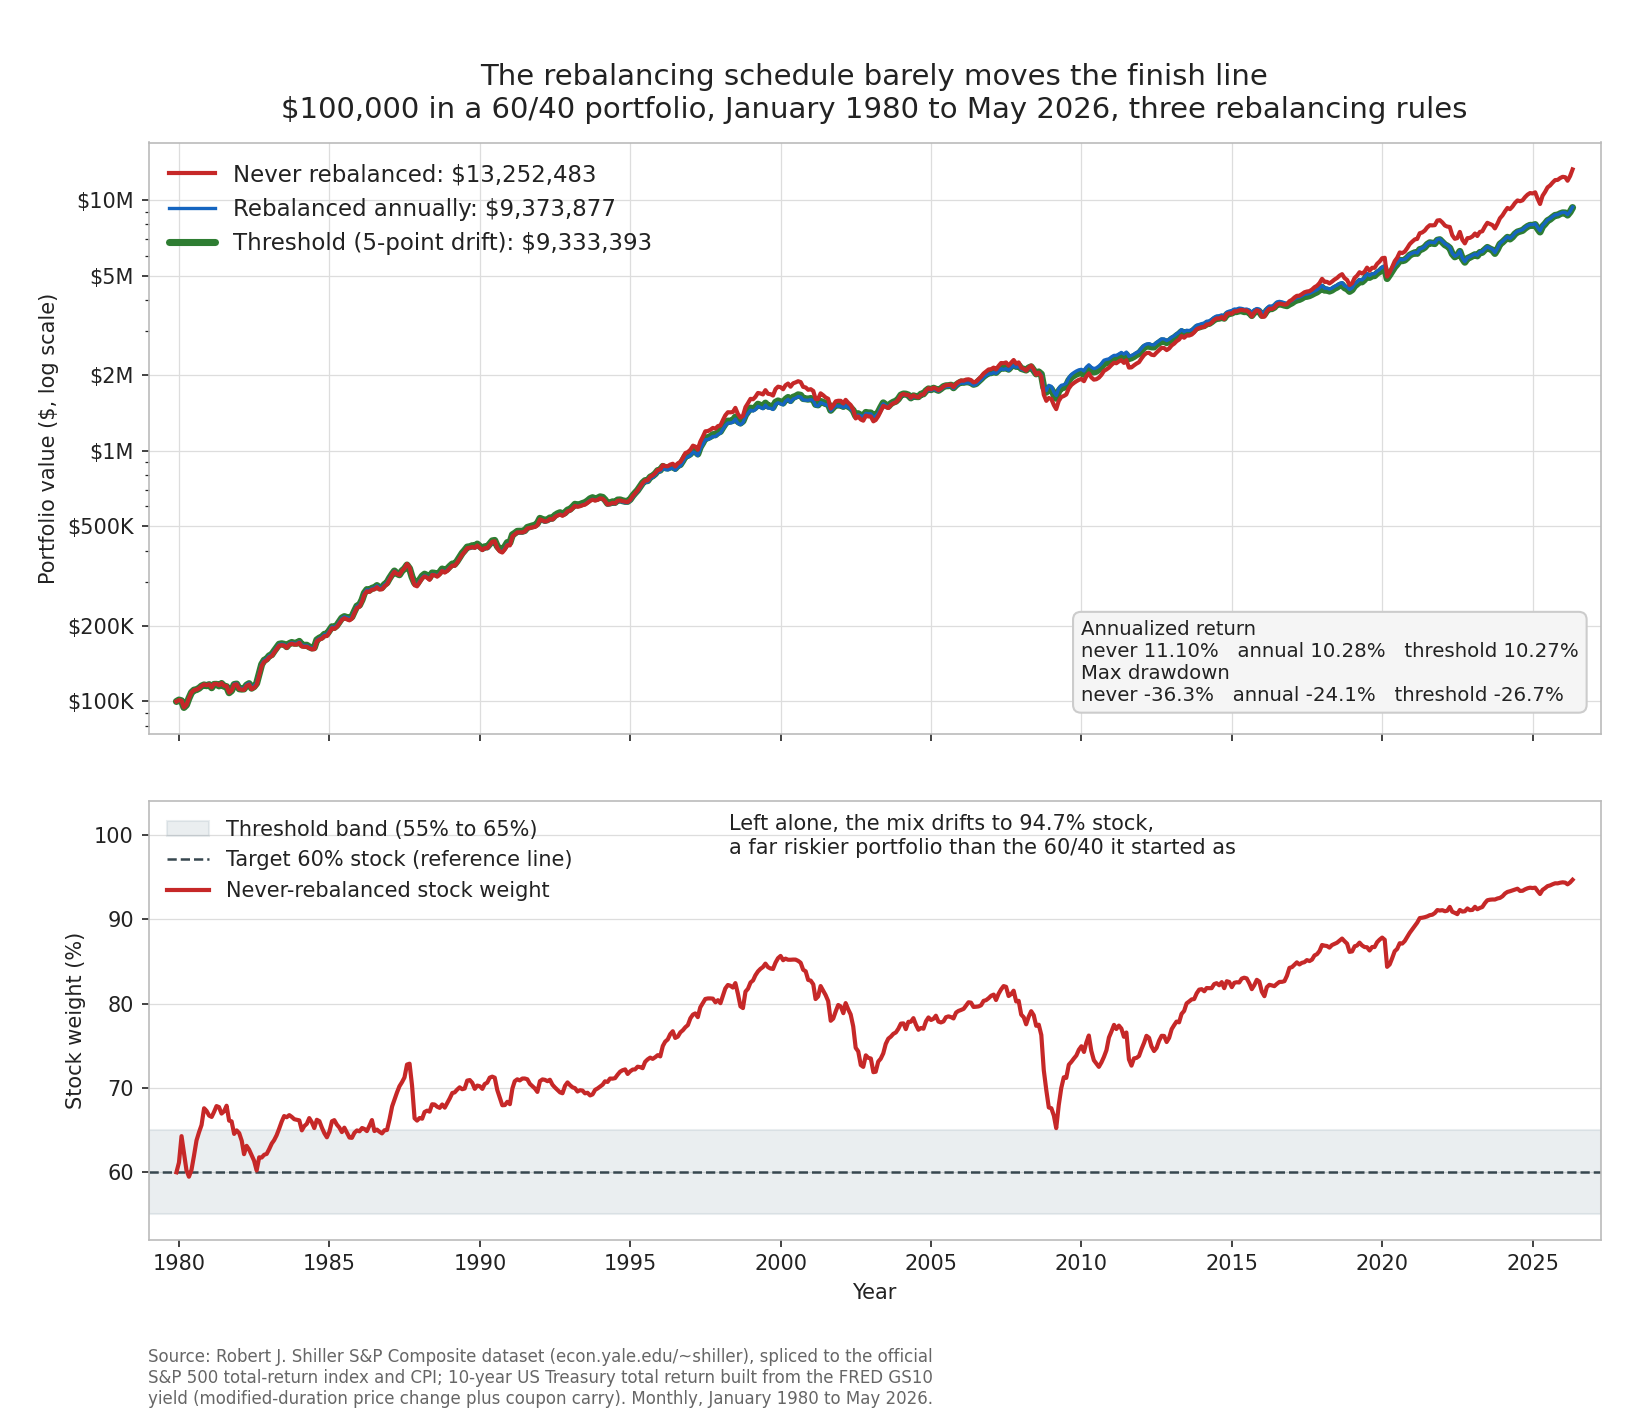
What rebalancing actually does to a portfolio
Two forces are at work every time you rebalance, and it helps to name them separately.
The first is mechanical risk control. Stocks are the volatile sleeve. Over long stretches they also grow faster than bonds, so left untouched they eat the portfolio. In my backtest, built from Robert J. Shiller’s S&P 500 total-return history spliced to the official total-return index and CPI (econ.yale.edu/~shiller), the S&P 500 compounded at 12.20 percent per year from 1980 through 2026 while a constant-maturity 10-year Treasury total return compounded at 6.37 percent per year. When one sleeve grows at nearly double the rate of the other for four decades, the fast sleeve takes over. The never-rebalanced portfolio started at the intended 60 percent stock and finished at 94.7 percent stock. It became a nearly all-equity portfolio without a single decision on your part. Rebalancing is the counterforce that keeps the stock weight pinned near your target, so the risk you carry stays the risk you signed up for.
The second force is a mild, automatic buy-low, sell-high. Every time you rebalance, you trim the asset that just outran the plan and add to the one that lagged. You are selling relative strength and buying relative weakness, on a fixed rule, with no forecasting involved. When two assets have similar long-run returns and do not move in perfect lockstep, this trimming can add a small amount of return over simply holding, a phenomenon sometimes called the diversification return or the rebalancing bonus. The key word is small, and the bonus is conditional. It shows up when the two sleeves finish close to each other. When one sleeve dominates as thoroughly as stocks dominated bonds since 1980, the buy-low, sell-high effect works against raw return, because every rebalance trims the winner and feeds the laggard.
That is exactly what the data shows, and it is the crux of the whole topic. Skipping rebalancing earned more dollars over this window, and it did so only by abandoning the 60/40 plan and morphing into a 95 percent stock portfolio. The extra return was extra risk wearing a disguise.
Three schedules, one nearly identical finish line
Here is the experiment. I put 100,000 dollars into a 60/40 portfolio on January 1, 1980, and ran it forward month by month through 2026 under three rules.
The first rule is never rebalance. Let the two sleeves drift wherever the market takes them. The second is rebalance annually, resetting to 60/40 every December. The third is a threshold rule, rebalancing back to 60/40 only when the stock weight drifts more than 5 percentage points away from 60, so a move below 55 or above 65 triggers a trade and small moves are ignored. The stock returns come from the total-return index with dividends reinvested. The bond returns come from the GS10 yield, converted to a monthly total return using a standard bond-math step: the coupon carry for the month plus the price change implied by the yield move times the modified duration of a par 10-year bond. The code documents the exact formula.
The results, computed over the full 557-month window:
- Never rebalanced: ended at 13,252,483 dollars, a 11.10 percent annualized return, with 9.90 percent annualized volatility and a worst peak-to-trough drawdown of 36.3 percent. Ending stock weight: 94.7 percent.
- Rebalanced annually: ended at 9,373,877 dollars, a 10.28 percent annualized return, with 8.04 percent annualized volatility and a worst drawdown of 24.1 percent. Ending stock weight: 61.6 percent.
- Threshold (5-point drift): ended at 9,333,393 dollars, a 10.27 percent annualized return, with 8.08 percent annualized volatility and a worst drawdown of 26.7 percent. Ending stock weight: 61.6 percent. It traded 27 times over the 46 years, roughly once every 20 months.
Look at the two schedules that actually keep the portfolio near 60/40. The annual rule returned 10.28 percent per year. The threshold rule returned 10.27 percent per year. That is a difference of one hundredth of a percentage point over 46 years, on portfolios that finished within about 40,000 dollars of each other on a base near 9.3 million. The annual schedule fired 46 times, the threshold schedule 27 times, and they landed in essentially the same place. If you were hoping the perfect calendar would find hidden return, the data says it will not. Any sensible schedule that returns you to target lands within noise of any other.
The never-rebalanced path looks like the winner in the top panel of the figure, finishing about 3.9 million dollars ahead. That gap is not a reward for patience. It is the payout for having drifted into a 95 percent stock portfolio and ridden the greatest four-decade run in US equity history at nearly full exposure. The same drift is why its worst drawdown was 36.3 percent against the annual rule’s 24.1 percent, and why its volatility ran 1.85 percentage points higher. You can earn the un-rebalanced return only by accepting the un-rebalanced risk, and that risk is a moving target that climbs every year the market rises.
Why the schedule matters less than people think
The intuition that a cleverer schedule must help comes from thinking of rebalancing as a return engine. Under that view, more frequent trimming should harvest more of the buy-low, sell-high bonus, so quarterly should beat annual and monthly should beat quarterly. The data does not cooperate, and there are two reasons why.
The first is that the rebalancing bonus is genuinely tiny relative to the difference in the assets’ own returns. Over 1980 to 2026, stocks beat bonds by almost 6 percentage points a year. Against a gap that large, the fractional return that trimming adds or subtracts is a rounding detail. The schedule is adjusting a small term while the market moves the big one.
The second reason is that trading more often has a cost that grows with frequency, so a faster schedule spends more to chase the same tiny bonus. In a frictionless simulation, extra trades are free, which is why my annual and threshold numbers are so close. In the real world, every trade can carry a bid-ask spread, and in a taxable account it can trigger a tax bill. A monthly schedule multiplies those frictions without buying you a meaningfully better outcome. The threshold approach is elegant for this reason. It only trades when the mix has actually wandered far enough to matter, so it ignores the small wiggles that a calendar rule would trade on and does its work in 27 trades where the annual rule used 46.
The engineering framing makes this click. Rebalancing is a controller holding a state variable, your stock weight, near a setpoint of 60 percent. A calendar rule samples on a fixed clock and corrects every tick whether or not the state has moved. A threshold rule is a deadband controller that acts only when the error leaves a tolerance band. Deadband control is the standard way to avoid burning actuator effort, here trades and taxes, on noise that does not need correcting. Both controllers hold the setpoint about equally well over the long run, so you may as well pick the one that acts less often and costs less to run.
The real cost is taxes, and new money is the workaround
Everything above assumes rebalancing is free. In a tax-sheltered account like a 401(k) or an IRA, it effectively is. You can sell appreciated stock and buy bonds inside those accounts and owe nothing, because gains are not taxed until withdrawal, or never in a Roth. That is the clean case, and it is where the schedule debate is purely academic.
A taxable brokerage account is different, and this is the cost that deserves your attention far more than whether you rebalance in March or December. When you sell a stock position that has grown, you realize a capital gain, and a realized gain is a taxable event. Long-term gains, on assets held more than a year, are taxed at 0, 15, or 20 percent at the US federal level depending on income, and a 3.8 percent net investment income tax can apply on top for higher earners, per current IRS rules. State taxes can add more. Short-term gains, on positions held a year or less, are taxed as ordinary income, which is worse. A rigid monthly or quarterly schedule in a taxable account can force you to realize gains you would otherwise let compound untaxed, and paying tax early to fund a rebalance surrenders some of the compounding that makes long-horizon investing work in the first place.
There is a clean way to keep your mix on target in a taxable account without triggering those sales. Rebalance with new money. If you are still contributing, direct each new deposit toward whichever sleeve is below its target weight. When stocks have run and you are stock-heavy, send the fresh cash to bonds until the mix comes back. You nudge the portfolio toward 60/40 using purchases alone, so no appreciated position is sold and no gain is realized. The same logic works with the cash that dividends and interest throw off. Reinvest it into the underweight sleeve instead of automatically buying more of what already dominates. For most people in the saving phase, contributions and distributions are large enough to hold the target mix for years without a single taxable sale.
When new money is not enough, because the drift is large or you are no longer contributing, a few habits keep the tax bill down. Do the selling inside your tax-sheltered accounts first, since those trades are free. If you must sell in a taxable account, favor lots held longer than a year to get the lower long-term rate, and pair any realized gains against realized losses you are harvesting elsewhere. A threshold rule helps here too, because trading only on meaningful drift means fewer taxable events than a monthly calendar would generate.
What the data actually prefers
The 46 years of numbers point to a simple, almost boring conclusion, and boring is the right answer here. Pick any reasonable schedule you will actually follow. Annual is fine. A 5-point threshold is fine and trades a bit less. The gap between them over four and a half decades was one hundredth of a percentage point a year, so the winning move is to choose one and stop optimizing it.
Judge rebalancing by risk, not by return. Its job is to keep your portfolio from silently becoming something riskier than you chose, the way the untouched 60/40 crept to 95 percent stock and a 36 percent drawdown. Over a roaring equity market it will usually cost you a little raw return, and that cost is the price of not betting your retirement on the market continuing to roar. In a flatter or more turbulent stretch, the same discipline is what stops a crash in the dominant asset from doing outsized damage.
Watch the tax cost, not the calendar. In sheltered accounts, rebalance freely. In taxable accounts, steer new contributions and dividends into the lagging sleeve so you rebalance by buying, keep any forced sales long-term and few, and let the deadband of a threshold rule spare you the trades that do nothing but generate a tax form. The schedule is where people spend their attention. The taxes are where the money is.
Sources
- Robert J. Shiller, “Irrational Exuberance” monthly S&P Composite dataset, http://www.econ.yale.edu/~shiller/data.htm, with the deep history extended to the latest month by the official S&P 500 total-return index and CPI. Backtest window January 1980 through 2026, 557 months. Stock returns from the total-return series (dividends reinvested). Over the window, S&P 500 total return compounded at 12.20 percent per year.
- 10-year US Treasury total return constructed from the GS10 constant-maturity yield: monthly total return equals the one-month coupon carry (previous yield divided by 12) plus the modified-duration price change from the month’s yield move, using the modified duration of a par 10-year annual-coupon bond at the prior month’s yield. Over the window this compounded at 6.37 percent per year.
- Strategy results over the window. Never rebalanced: 13,252,483 dollars ending value, 11.10 percent annualized return, 9.90 percent annualized volatility, 36.3 percent max drawdown, 94.7 percent ending stock weight. Rebalanced annually (every December): 9,373,877 dollars, 10.28 percent, 8.04 percent, 24.1 percent, 61.6 percent. Threshold (rebalance when stock weight drifts more than 5 points from 60): 9,333,393 dollars, 10.27 percent, 8.08 percent, 26.7 percent, 61.6 percent, with 27 rebalancing events.
- US capital gains tax treatment (long-term rates of 0, 15, or 20 percent, the 3.8 percent net investment income tax, and ordinary-income treatment of short-term gains) per current IRS rules. Rates and thresholds change; confirm the current year’s numbers before acting.