The S&P 500 returned about 10.15 percent a year from 1928 to 2025. After inflation, it returned 6.90 percent. That 3.25-point gap is the difference between a plan that works and one that quietly fails.
Both numbers come from the same source and the same window. I computed them from a monthly S&P 500 total-return series built on Robert Shiller’s dataset and extended to the latest month with the official S&P 500 indices and CPI, reinvesting dividends and measuring 98 complete calendar years, December 1927 to December 2025. The only difference between the two numbers is whether I deflated by the Consumer Price Index. One number counts dollars. The other counts what those dollars buy. When you run a 30-year projection with the wrong one, you overstate the result by 146 percent. Here is that gap drawn out over a single 40-year holding period, the same 10,000 dollars tracked in market dollars and in purchasing power.
Two rates from one price history
Start with the raw fact. Ten thousand dollars invested in the S&P 500 in December 1927, with every dividend reinvested, grew at an annualized rate of 10.15 percent through December 2025. “Annualized” here means the geometric rate, the single constant rate that reproduces the actual start-to-end multiple over 98 years. It is the honest way to describe a growth path, because it already accounts for compounding and for the down years that a simple average hides.
That 10.15 percent is a nominal rate. Nominal means the number is stated in the dollars of each year as they arrived, with no adjustment for the fact that a 1928 dollar and a 2025 dollar are not the same unit. Over those 98 years the CPI rose 18.85x in my dataset, an annualized inflation rate of 3.04 percent. A dollar at the end of the window bought roughly one nineteenth of what it bought at the start.
Deflate the total-return series by that CPI, and the same investment grew at 6.90 percent a year in constant purchasing power. This is the real return. Real means measured in a fixed unit of buying power, so a real dollar in 2025 commands the same basket of goods as a real dollar in 1927. Real return is the rate that tells you how much more you can actually consume, which is the only reason to invest in the first place.
Nothing changed about the underlying prices between these two numbers. The 10.15 percent and the 6.90 percent describe the identical account, holding the identical shares, over the identical century. The gap is entirely the erosion of the measuring stick.
Why the gap is not just subtraction
The tempting shortcut is real equals nominal minus inflation. On my numbers that gives 10.15 minus 3.04, or 7.11 percent. The true real return is 6.90 percent. The shortcut is off by 21 basis points, and it is always biased in the same direction, too optimistic.
The exact relationship is the Fisher equation, named after the economist Irving Fisher. It states that one plus the real return equals one plus the nominal return, divided by one plus inflation:
(1 + real) = (1 + nominal) / (1 + inflation)Rearranged, real equals (1 + nominal) / (1 + inflation) minus 1. Plugging in 10.15 percent and 3.04 percent gives 6.90 percent, which matches the directly deflated series to the basis point. My figure script prints both side by side so you can see they agree.
An engineer will recognize the structure. Return and inflation are multiplicative gains applied in series, so they compound against each other, and you cannot combine two multiplicative factors by adding them. You divide. The subtraction shortcut treats a ratio as a difference. At 3 percent inflation the error is small, about 0.2 points. At 8 percent inflation the shortcut overstates your real return by closer to 0.6 points, and the mistake grows exactly when it hurts most, in a high-inflation decade when you most need an accurate read.
There is also a second number people quote, and it is worth separating cleanly, because mixing it up is where the “S&P returns 12 percent” claims come from. The arithmetic mean of the 98 annual nominal returns in my dataset is 11.90 percent. The arithmetic mean of the annual real returns is 8.64 percent. The arithmetic mean is the simple average of the yearly numbers. It is always higher than the geometric rate whenever returns vary, because a gain and an equal-sized loss do not cancel. Lose 50 percent, then gain 50 percent, and you are down to 75 cents on the dollar, even though the two years average to zero.
Use the arithmetic mean when you are describing the expected outcome of a single future year in isolation. Use the geometric rate when you are compounding a balance across many years, which is what every retirement projection does. For a multi-decade plan, the geometric rate is the one that ties out to reality. I use 6.90 percent real and 10.15 percent nominal for every projection in this article. I never use 11.90 percent to grow a balance forward, and neither should any calculator you trust.
The 40-year account
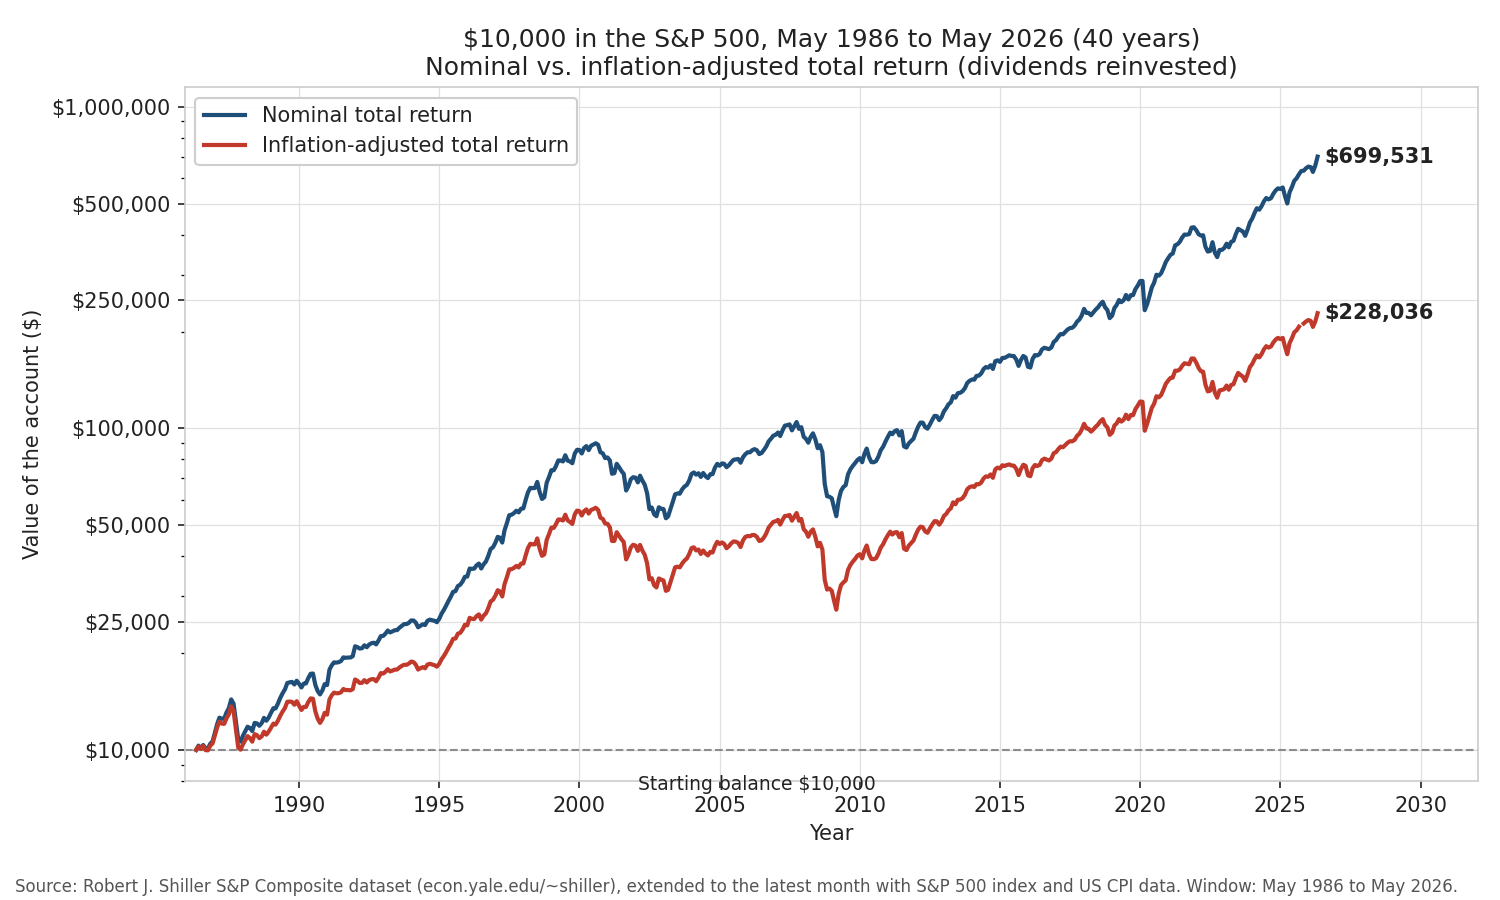
The figure at the top of this article shows the mechanism on a real window. It plots 10,000 dollars invested in the S&P 500 in May 1986 and held for 40 years, through 2026, the most recent month in the dataset. The blue line is the nominal total-return value. The red line is the same account measured in constant May-2026 purchasing power.
The blue line ends at 699,531 dollars, and the red line ends at 228,036 dollars. Both describe the exact same shares in the exact same account. The blue line is the brokerage statement. The red line is what that statement could actually buy at the end, expressed in end-of-period dollars.
Two things are worth reading off the chart. The vertical distance between the lines widens as you move right, because inflation compounds along with returns, so the drag accumulates. And both lines climb, which is the point that the real number is not a reason to stay out of the market. The real line still turned 10,000 dollars into more than 225,000 dollars in genuine buying power over 40 years. Stocks beat inflation handily here. The correction is not “expect less.” The correction is “measure in the right unit, or your plan will lie to you.”
I put the y-axis on a log scale on purpose. On a log scale, a straight line is a constant compound rate, and equal vertical gaps are equal percentage gains. The steady upward slope of both lines, interrupted by the 1987, 2000, 2008, and 2020 drawdowns, is what constant-rate compounding actually looks like once you strip out the visual distortion of a linear axis.
What the wrong rate does to a 30-year plan
Here is the number that should change how you use a retirement calculator. Take a single lump sum of 10,000 dollars and project it forward 30 years, the length of a typical accumulation runway.
At the nominal rate of 10.15 percent, 10,000 dollars becomes 181,607 dollars. At the real rate of 6.90 percent, it becomes 73,914 dollars. The nominal projection is 2.457 times the real one. Stated as an overstatement, using the nominal rate overestimates your future purchasing power by 145.7 percent over 30 years.
That is not a rounding error. That is the difference between believing you will have a six-figure spending base and actually having a mid-five-figure one, in the money that will buy your groceries. The 181,607-dollar number is not wrong as a count of future dollars. It is wrong as a measure of what those dollars will do, because 30 years of 3 percent inflation will have shrunk each of them by more than half.
The failure mode is specific and common. A calculator asks for an expected return, you type in the 10 percent you half-remember from a headline, and it hands back a nominal balance. Then you mentally spend that balance at today’s prices. You have silently combined a future-dollar amount with present-day purchasing power, and the two do not belong in the same sentence.
There are two clean ways to fix it, and you must pick one and stay in it. One way projects in real terms. You use the 6.90 percent real rate, and you read the answer as today’s dollars, directly comparable to today’s grocery bill. The other way projects in nominal terms. You use the 10.15 percent nominal rate, then inflate your target spending by the same CPI assumption so both sides live in future dollars. Both are correct. What breaks a plan is a nominal growth rate paired with a real, present-day spending goal, which is exactly the pairing a naive calculator run produces.
Control theory has a name for the discipline this requires. If your setpoint, the target you are steering toward, is stated in one unit, then your feedback signal, the projected balance you compare against it, must be stated in that same unit. Feed a controller a signal in the wrong units and it will confidently drive the system to the wrong place. A retirement plan is a slow controller with a 30-year loop, and inflation is the unit mismatch that sends it off course while every intermediate reading still looks fine.
The number to carry
Nominal return is what the market prints. Real return is what you get to keep in purchasing power, and over 1928 to 2025 the market handed back 6.90 percent of it per year after inflation, not the 10.15 percent on the statement. The two differ by the compounding of a 3.04 percent inflation rate, combined through the Fisher equation, one plus real equals one plus nominal over one plus inflation. Carry the real number into any projection longer than a few years, because across 30 years the nominal rate overstates your actual buying power by 146 percent, and the error only grows with the horizon.
Sources
- Robert J. Shiller, “Irrational Exuberance” online dataset, U.S. Stock Markets 1871-present, Yale University, http://www.econ.yale.edu/~shiller/data.htm. Monthly S&P Composite prices, dividends, earnings, and CPI. The Shiller deep history is extended to the latest month with the official S&P 500 price and total-return indices and the CPI. Total return reinvests one twelfth of the annualized dividend each month at that month’s price; real series deflate by CPI. All annualized numbers cover December 1927 to December 2025 (98 full calendar years).
- Irving Fisher, The Theory of Interest (1930), for the relationship between nominal rates, real rates, and inflation.