Prepaying a dollar of mortgage principal earns a guaranteed return equal to your mortgage rate. Investing that same dollar earns more on average and nothing on schedule. That single sentence is the whole debate, and most people argue it without ever naming the two numbers that decide it: the rate you are guaranteed by paying down debt, and the rate you might get by putting the money in the market instead.
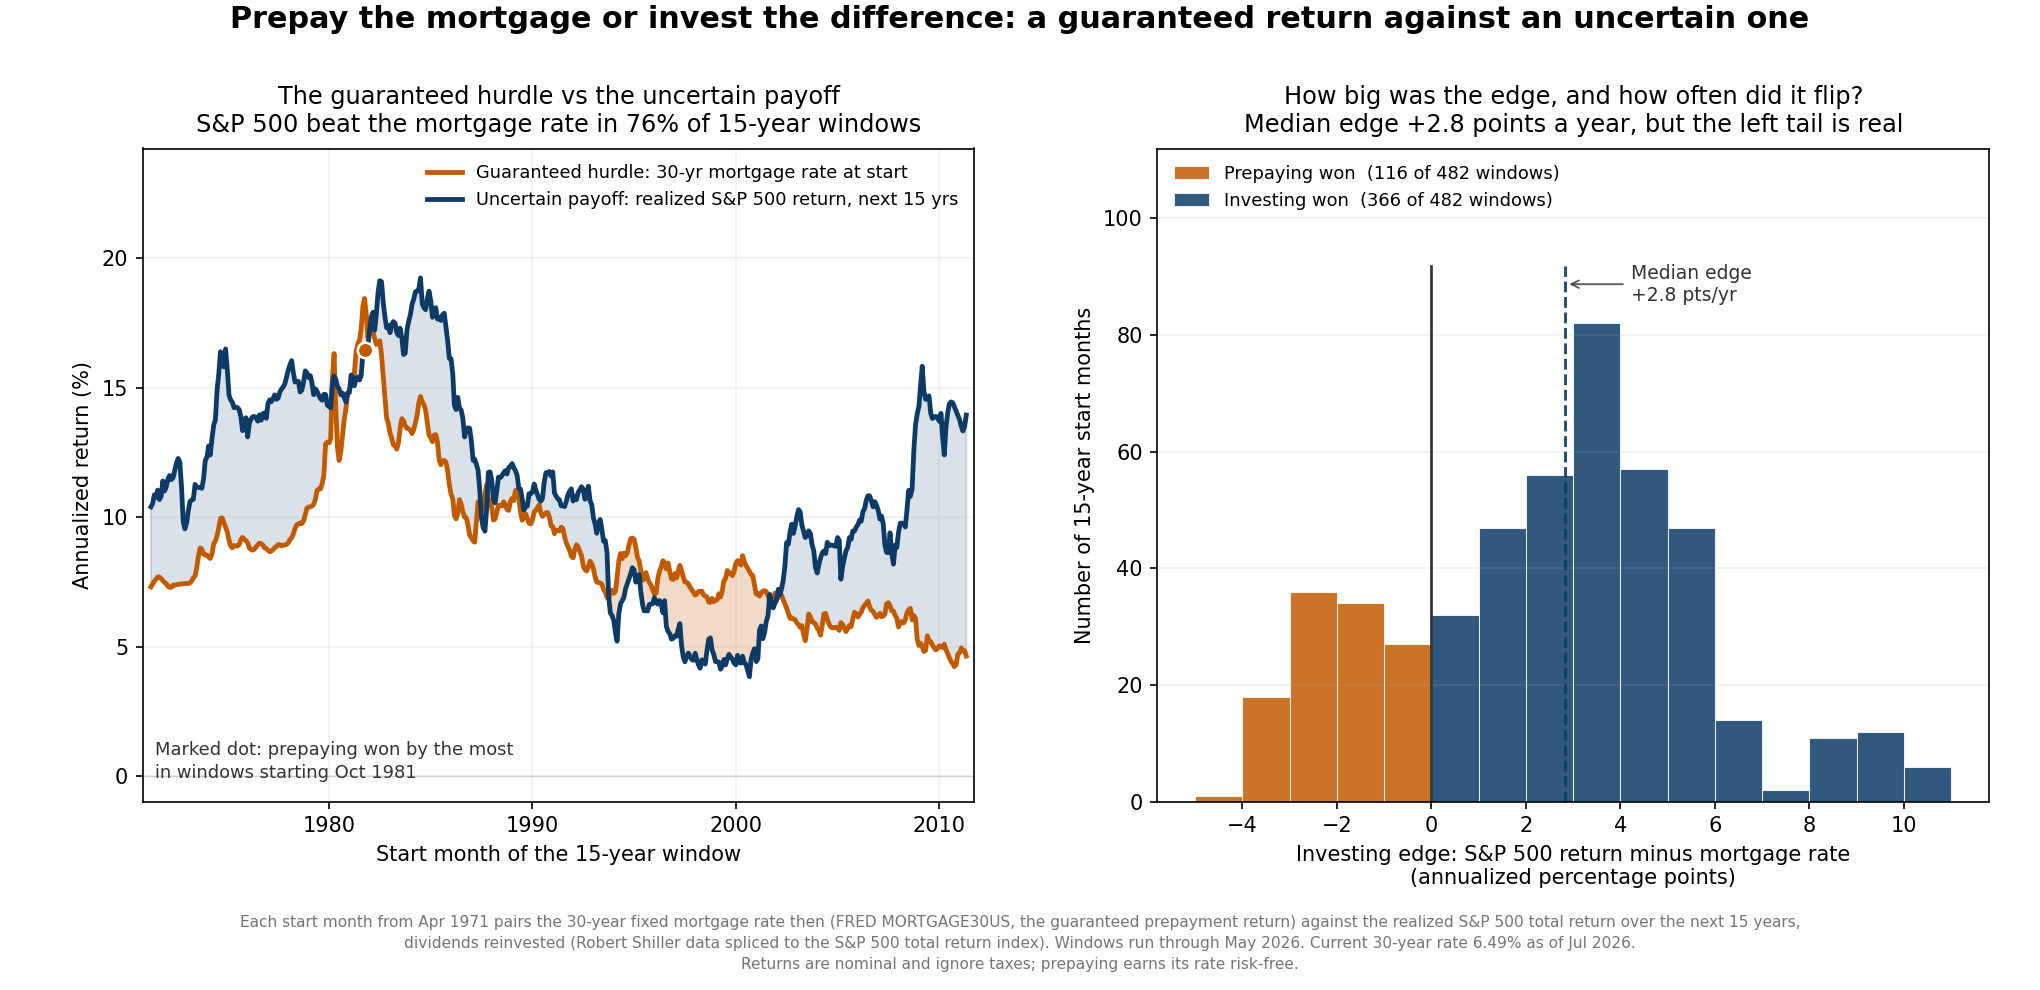
The comparison is cleaner than it looks. Every extra dollar you send to the principal removes future interest at your mortgage rate. If your loan charges 6.5 percent, a prepaid dollar spares you 6.5 percent a year, compounding, with no default risk and no volatility. It is as close to a risk-free return as a household ever gets. The alternative is to keep that dollar and invest it in a stock index. The S&P 500 has returned more than 6.5 percent a year over most long stretches, so on average investing wins. The word doing the heavy lifting is average. To see how the average is built, and how often it fails, I pulled the real history and pitted the two choices against each other for every start month since 1971. The chart below shows every one of those matchups.
The mortgage rate is the hurdle everything else must clear
Think of your mortgage rate as a hurdle height. Any use of a spare dollar has to clear that height to be worth doing instead of paying down the loan, because paying down the loan clears it by definition. This reframes the question in a way that removes the emotion. You are not asking whether the stock market is a good investment in the abstract. You are asking whether the market, after tax and after the gut-punch of watching it fall, is likely to clear a bar set exactly at your mortgage rate.
The bar moves with the era, and it moves a long way. The 30-year fixed rate averaged around 6.5 percent in 2026, with the weekly reading at 6.55 percent on 2026, according to FRED series MORTGAGE30US. That is a middling bar by historical standards. In October 1981 the same series sat at 18.45 percent. A homeowner in 1981 who prepaid earned a guaranteed 18.45 percent a year, a return most professional investors never touch. In late 2020 and 2021 the rate briefly fell under 3 percent, and the bar was so low that almost any diversified portfolio sailed over it. The right choice in 1981 and the right choice in 2021 were different choices, and the reason is entirely in the hurdle.
The hurdle is also guaranteed in a way no investment return is. When you prepay, the 6.5 percent you save is contractual. It does not depend on earnings, valuations, or the mood of the market fifteen years from now. That certainty has a value of its own, and finance has a name for it. A guaranteed 6.5 percent is worth more than an expected 6.5 percent with a wide range of outcomes around it, because you can spend a certainty and you cannot spend an average.
What the last five decades actually did
I compared the two choices over every 15-year window with real data. For each start month from April 1971 onward, I compounded that month’s 30-year mortgage rate for 15 years to get the guaranteed prepayment outcome, then measured the realized total return of the S&P 500 with dividends reinvested over the same 15 years, using Robert Shiller’s dataset spliced to the official S&P 500 total return index. That gives 482 overlapping windows ending as late as 2026.
Investing won 366 of them, about 76 percent. The median edge was 2.83 percentage points a year, which turned a 10,000 dollar decision into roughly 14,000 dollars of extra wealth by the end of the typical window. Over 10-year windows the story is similar and slightly friendlier to investing, which won 81 percent of the time with a median edge of 2.63 points a year. The market clears a mid-single-digit hurdle most of the time, and when it clears, it often clears by a lot. The best 15-year window for investing began in March 2009 at the bottom of the financial crisis, when the mortgage rate was 5 percent and the S&P went on to compound at 15.83 percent, a 10.83 point annual edge worth almost 70,000 dollars on a 10,000 dollar choice.
The left tail is where the argument earns its keep. Investing lost 116 of the 482 windows, and the losses cluster in two recognizable places on the chart. The first is the early 1980s, where the orange hurdle towers over everything. The single worst 15-year window for investing began in October 1981. The S&P still delivered a superb 16.48 percent a year over the next decade and a half, and it still lost, because the mortgage rate that month was 18.45 percent. A guaranteed 18.45 percent beat a realized 16.48 percent, and prepaying came out ahead by more than 28,000 dollars per 10,000 dollars committed. That is the purest illustration of the hurdle idea in the whole record. A magnificent stock return can still fall short when the bar is set high enough.
The second cluster sits around the year 2000. A window that began in June 2000, at the peak of the dot-com bubble, faced a mortgage rate of 8.29 percent and then watched the S&P deliver only 4.38 percent a year through the lost decade that followed. Prepaying won that matchup by nearly 4 points a year. Over the shorter 10-year horizon the dot-com timing was even more brutal, and the worst 10-year window, starting in mid-2000, saw investing trail by 9.45 points a year.
One pattern in the data cuts against intuition and is worth stating plainly. A high mortgage rate does not, by itself, make prepaying the favorite. Among the 259 windows where the starting rate was above 8 percent, investing still won 83 percent of the time, because high mortgage rates in the 1970s and 1980s came bundled with high inflation and the enormous bull market that followed. What the high-rate windows changed was the size of the loss when prepaying did win. The bar was tall, so the misses were expensive. When the starting rate was below 6 percent, investing won every single one of the 62 windows. Today’s 6.5 percent sits in the awkward middle, high enough that the guarantee is genuinely attractive and low enough that the market has usually beaten it.
Taxes quietly changed the math in 2018
For decades the standard rebuttal to prepaying was the mortgage interest deduction. If the government subsidizes your interest, the argument went, your effective mortgage rate is lower than the sticker rate, so the hurdle is lower and investing looks better. That argument is mostly dead, and it died on a specific date.
The Tax Cuts and Jobs Act of 2017 roughly doubled the standard deduction starting with the 2018 tax year. For 2025 the standard deduction is 15,000 dollars for a single filer and 30,000 dollars for a married couple filing jointly, according to the IRS. Mortgage interest only reduces your taxes if you itemize, and you only itemize if your deductible expenses beat that standard amount. Because the standard deduction is now so large, most households no longer clear it. Before the law, roughly one in three filers itemized. After it, only about one in ten does, according to estimates from the Tax Policy Center. For the other nine in ten, the mortgage interest deduction is worth nothing at the margin, so the true cost of the mortgage is the full stated rate. A 6.5 percent loan is a 6.5 percent hurdle, with no tax haircut to soften it.
Taxes cut the other way too, and in the same direction for the decision. The guaranteed return from prepaying is untaxed, because you never earn income, you avoid an expense. The uncertain return from investing in a taxable brokerage account is taxed when you sell, which trims the after-tax edge the market needs to clear the bar. Dollars invested inside a 401(k) or an IRA grow without that annual drag and often arrive with an employer match or an upfront deduction, which tilts the comparison back toward investing. The honest version of the tax story is that a taxable-account investor faces a slightly higher effective hurdle than the sticker rate, while a tax-advantaged investor with a match faces a much lower one. Fill the matched retirement accounts before you argue about prepaying at all, because a 50 percent match is a guaranteed return that dwarfs any mortgage rate in this dataset.
Liquidity and the value of sleeping at night
The chart measures dollars, and dollars are not the only thing at stake. Two considerations sit outside the backtest and often decide the question in real households.
The first is liquidity. A dollar you invest stays reachable. You can sell a fraction of an index fund next week to cover a job loss, a medical bill, or a chance to buy something on sale. A dollar you send to your mortgage principal disappears into the house and is hard to get back. To reclaim it you have to sell the home, refinance, or open a home equity line, and lenders are least willing to extend that credit at the exact moment you need it most, when your income has dropped. Prepaying converts liquid, flexible wealth into illiquid, committed wealth. For a household without a solid emergency fund, that trade can be dangerous even when the arithmetic favors it, because being right on a 15-year average is no comfort during a six-month cash crunch.
The second is risk tolerance, and it is the reason the 76 percent figure does not settle the matter for everyone. The market clears the hurdle most of the time, and it does so while falling 30 or 40 percent along the way in the bad years. An investor who panics and sells during one of those drawdowns can convert a winning 15-year bet into a realized loss, which is worse than any prepayment outcome in the data. Paying off the mortgage delivers a return no market crash can take away, and it delivers something the spreadsheet cannot price, which is the feeling of owning your home outright. Being debt-free lowers your fixed monthly obligations, which shrinks the income you must earn to survive and widens your options in a layoff or a career change. Plenty of people rationally accept a lower expected outcome to get that certainty, and they are not making a mistake. They are buying peace with a known price.
How to decide without a spreadsheet
The framing does most of the work, and you can run it in your head. Write down your mortgage rate. That is your hurdle and your guaranteed return. Ask whether a diversified stock portfolio, after the taxes you would actually pay and after your honest assessment of whether you would hold through a crash, is likely to clear that bar over the years you plan to keep the loan. At today’s 6.5 percent, history says the market clears it about three times out of four over 15 years, which is a real edge and a real one-in-four chance of regret. At 3 percent the bar is so low that investing is close to automatic. At 8 percent or more the guarantee gets genuinely hard to beat, and the years it wins, it wins big.
Sequence matters more than the headline choice. Build the emergency fund first, because it protects the liquidity that prepaying destroys. Capture every dollar of employer match next, because that guaranteed return is larger than any mortgage rate in this record. Only then does the prepay-or-invest question become live, and at that point it is less a math problem than a statement about yourself. The math leans toward investing at ordinary mortgage rates, and it does so by a margin that history put at a bit under 3 percentage points a year. The person who splits the spare dollar, sending some to the principal and some to the index fund, gets part of the guarantee and part of the expected edge, and never has to be fully right about which era they are living in. That is a reasonable answer to a question whose correct value you cannot know until the 15 years are over.
Sources
- Federal Reserve Economic Data (FRED), series MORTGAGE30US, 30-Year Fixed Rate Mortgage Average in the United States, weekly, Freddie Mac Primary Mortgage Market Survey. https://fred.stlouisfed.org/series/MORTGAGE30US
- Robert J. Shiller, online data for U.S. stock prices, dividends, earnings, and CPI, spliced to the S&P 500 total return index for the recent tail. http://www.econ.yale.edu/~shiller/data.htm
- Internal Revenue Service, 2025 standard deduction amounts (Revenue Procedure 2024-40). https://www.irs.gov
- Tax Policy Center, estimates of the share of filers itemizing deductions before and after the Tax Cuts and Jobs Act of 2017. https://www.taxpolicycenter.org