A fund labeled “3x” tells you exactly one thing about its behavior, and it is not the thing most buyers assume. It promises three times the index return for a single trading day. Multiply that promise across years and you do not get three times the index. You get a path dependent number that can beat 3x wildly or wipe you out almost completely, and which of those you get is decided by volatility, not by the sticker on the fund.
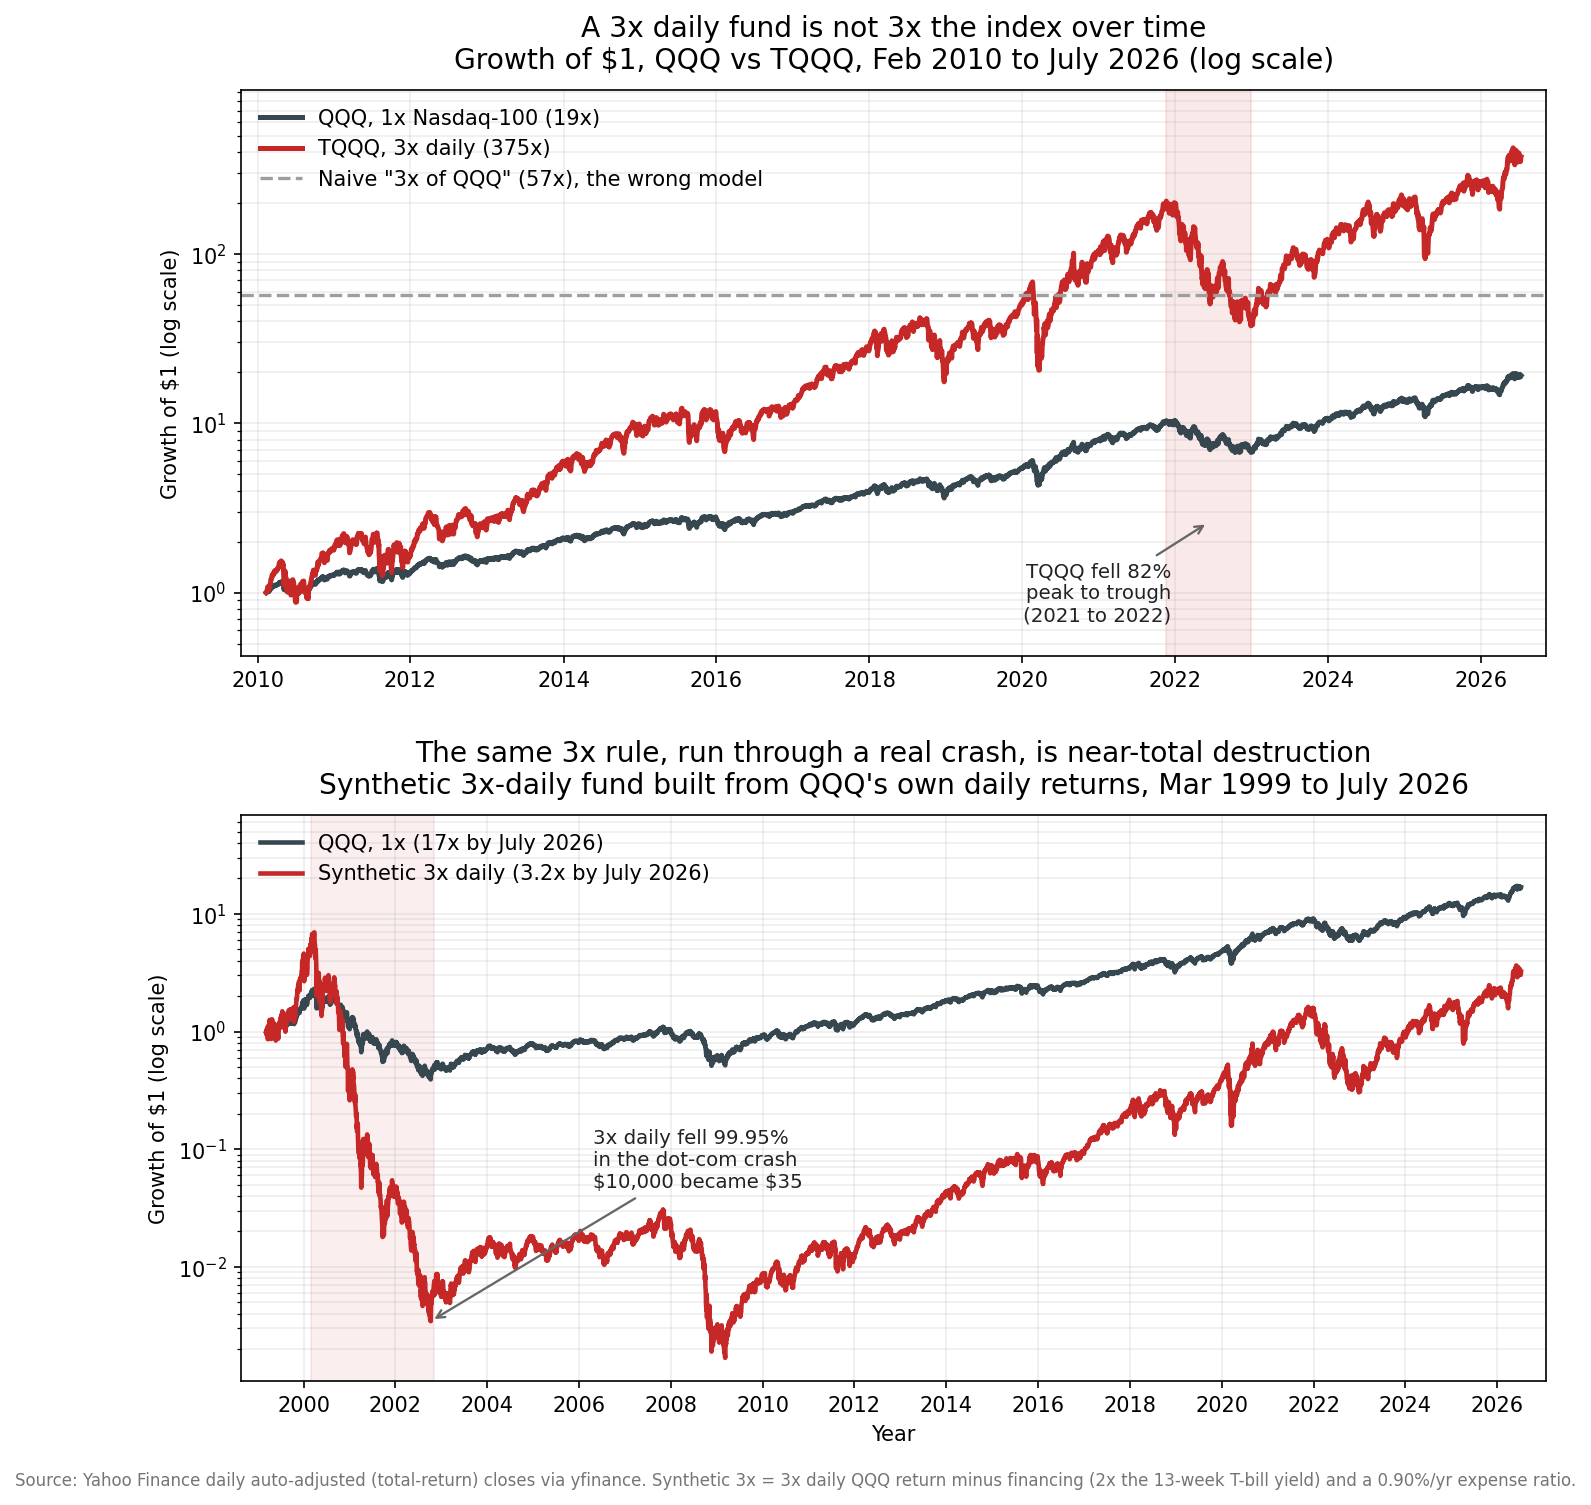
I ran the numbers on the two funds most people mean when they say this. QQQ is the Invesco trust tracking the Nasdaq-100. TQQQ is the ProShares fund that targets three times the daily return of that same index. I pulled daily total-return prices for both from Yahoo Finance, from TQQQ’s launch on 11 February 2010 through 10 2026, and I built a synthetic 3x fund from QQQ’s own daily returns so I could run the same mechanism back through the 2000 dot-com crash. The result is a story with two faces, and the chart below tells both of them: TQQQ’s real run since 2010 in the top panel, and the synthetic fund’s trip through the dot-com crash in the bottom.
The Reset Nobody Reads
Here is the mechanic that makes everything else follow. A 3x daily fund does not hold a fixed 3x bet and let it ride. Every single trading day it rebalances so that tomorrow’s exposure is again exactly three times its current net asset value. Engineers will recognize this as a controller with a fixed setpoint. The setpoint is “leverage equals three,” and the fund re-solves for it at every close, buying more exposure after an up day and selling exposure after a down day.
That daily reset is why the fund can only promise a daily multiple. Compounding does the rest, and compounding does not distribute over addition. Three times the sum of daily returns is not the same as the product of three-times-each-daily-return. A trivial two-day example makes it concrete. Say the index rises 10 percent then falls 10 percent. It ends at 0.99, down 1 percent. A 3x daily fund rises 30 percent then falls 30 percent, landing at 1.30 times 0.70, which is 0.91. It is down 9 percent. The index lost 1 percent and the 3x fund lost 9 percent over the identical round trip, and no fee explains the gap. It is pure path arithmetic, and it scales with the square of the leverage. Nine is three squared, and that nine returns when we measure the drag.
When Leverage Looks Like Free Money
Here is the face that fund marketing loves. Over the stretch I measured, the daily reset worked spectacularly in the holder’s favor.
From February 2010 to 2026, QQQ turned one dollar into 19.16 dollars, a compound annual growth rate of 19.72 percent. Over the same window TQQQ turned one dollar into 374.69 dollars, a compound annual growth rate of 43.50 percent. If you believed the naive mental model, that “3x means triple the return,” you would have expected roughly three times QQQ’s 19.16, which is 57.49 dollars. TQQQ did not deliver 57 dollars. It delivered 375. It beat the naive 3x number by more than six times over.
The top panel of the chart above shows this on a log scale, which is the only honest way to plot something that moved this far. The dark line is QQQ climbing to 19x. The red line is TQQQ climbing to 375x, far above the grey dashed line that marks where a simple “3x of QQQ” would sit. Anyone who tells you a leveraged ETF always underperforms its multiple is contradicted by this chart. Over a long, mostly smooth uptrend, daily leverage compounds in your favor, and the compounding runs away to the upside.
The reason is the mirror image of the round-trip loss above. In a persistent uptrend, each up day lifts the base that the next day’s 3x return is applied to. Gains stack on a growing balance. The Nasdaq-100 spent most of the 2010s and 2020s grinding higher with only moderate interruptions, and that is precisely the environment where a daily-reset 3x fund earns more than three times the index. Leverage is not a scam. It is a bet on smoothness, and for this particular window the market was smooth enough to pay.
The Drag That Scales With the Square
So why does anyone warn about these funds? Because the same math that rewarded smoothness punishes volatility, and it punishes it at nine times the rate you might guess.
The tool for seeing this is the relationship between two kinds of average. The arithmetic return is the simple average of the periodic returns. The geometric return is what your money actually compounds at, the constant rate that would carry your starting balance to your ending balance. They are not equal, and the gap between them is volatility drag. A close approximation is that the geometric return equals the arithmetic return minus half the variance of returns. Variance is volatility squared, so choppier returns carry a bigger subtraction.
I computed this directly on QQQ’s daily returns. Annualized, QQQ’s arithmetic return was 13.98 percent, its volatility was 26.95 percent, and its variance was 0.0726. Half that variance is 3.63 percent, so QQQ’s own geometric return sits about 3.63 percentage points below its arithmetic return, at roughly 10.35 percent. That is the drag the unlevered index already pays for being volatile.
Now apply leverage. When you scale daily returns by three, you scale their volatility by three as well, and volatility enters the drag as a square. Three squared is nine. The drag term for a 3x fund is not 3 times 3.63 percent, it is 9 times 3.63 percent, which is 32.67 percent a year. A 3x fund carries roughly nine times the volatility drag of the index it tracks. That single fact is the whole risk in one line. You are paying nine times the compounding penalty for choppiness, and you only come out ahead if the index trends hard enough and smoothly enough to outrun a headwind of that size.
This is why the outcome is path dependent and cannot be read off the multiple. The 3x is a promise about direction and magnitude for one day. Over years, the fund’s fate is a tug of war between the trend, which leverage amplifies in your favor, and the drag, which leverage amplifies against you at the square of the leverage. In the 2010 to 2026 window the trend won by a mile. That is not a law. It is a specific outcome for a specific path.
The Crash the Marketing Chart Cannot Show
TQQQ has never lived through a genuine equity depression, because it launched in February 2010, eleven months after the 2009 bottom. Its whole life has been a bull market with corrections. To see what daily leverage does in the other kind of market, I built a synthetic 3x fund from QQQ’s actual daily returns and ran it back to March 1999. Each day it earns three times QQQ’s return, then pays a financing cost tied to the 13-week Treasury bill yield on the two dollars of borrowed exposure per dollar of assets, plus a 0.90 percent annual expense ratio to match TQQQ. This is the same recipe TQQQ follows, applied to a market that actually crashed.
The bottom panel of the figure shows the result, and it is brutal. Through the dot-com collapse the Nasdaq-100 itself fell about 82.96 percent from its 2000 peak. The synthetic 3x fund fell 99.95 percent. A 10,000 dollar stake placed at the March 1999 start would have been worth about 35 dollars at the crash trough. That is not a drawdown you recover from by waiting. It is a near-total loss, and the reason is the same daily reset that looked so generous in the bull run. When the index falls day after day, each 3x down day is applied to a base the previous down days already gutted, and the losses compound toward zero. A leveraged fund cannot go negative, but it can get arbitrarily close, and 99.95 percent is close.
The long tail of that chart carries the lesson that timing is not a footnote. The synthetic 3x fund and the 1x index both start at one dollar in March 1999. By 2026, twenty-seven years later, QQQ sits at 16.86 times its start. The synthetic 3x fund sits at 3.23 times. The leveraged fund, bought near a market top, finished the entire period worth barely a fifth of the boring unlevered index, because the hole it dug in 2000 to 2002 was so deep that even a decade and a half of leveraged bull market could not climb out of it. Same fund, same rules, same market. The only difference from the winning story is where the clock started.
What the Two Faces Are Telling You
The worst real drawdown in the data underlines the fragility. TQQQ’s deepest peak-to-trough fall was 81.7 percent, from November 2021 to December 2022, while QQQ over the same span fell 35.1 percent. That is the shaded band in the top panel. A holder who bought TQQQ at the 2021 high watched more than four fifths of their money evaporate over about thirteen months. Many did not hold to the recovery, and selling anywhere in that trench locked in a catastrophe. The 35 percent index drop was survivable. The 82 percent leveraged drop was, for a lot of people, not.
Put the pieces together and the honest picture is not a slogan. A 3x daily fund is not 3x cumulative, because the daily reset makes the long-run outcome path dependent. It carries roughly nine times the volatility drag of its index, since drag scales with the square of leverage. It can beat 3x handsomely in a long smooth uptrend, as TQQQ did on its way from one dollar to 375. It can also lose 82 percent in a normal bear market or 99.95 percent in a real crash, and it is savagely sensitive to the price you paid to get in. Leverage is a machine that converts market smoothness into outsized gains and market roughness into ruin, and you do not get to choose which one the next decade delivers.
The daily reset is doing exactly what it says on the label. The gap between what it says and what people hear is where the money is lost. Read the label as a statement about one day, treat the multiple over any longer horizon as unknown until the path is done, and size the position as if the 99.95 percent line in the figure is a live possibility, because for the funds that predate 2010 it already happened.