You bought 505 stocks. The arithmetic says you effectively own about 48, and ten of them are close to one trade on artificial intelligence. That is the state of the S&P 500 in 2026, and it is worth measuring precisely, because the gap between what an index fund is called and what it currently holds has never been wider in the data I can find.
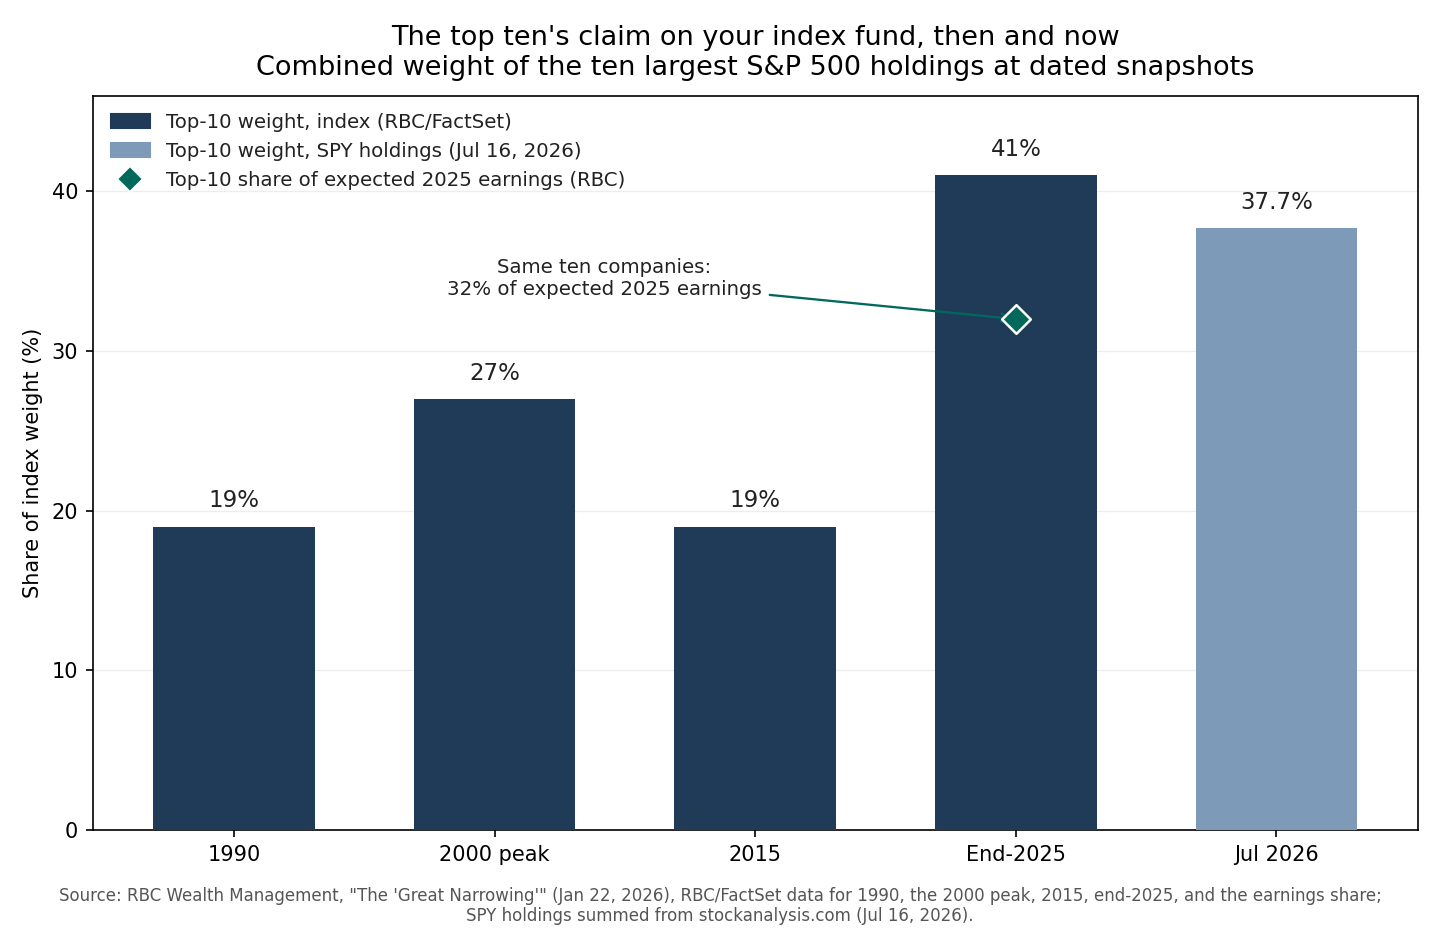
I have written before about how cap weighting concentrates an index all by itself, with no committee deciding to bet on your behalf. That article traced the mechanism. This one measures its output as of this month, using the fund’s own published holdings, and then asks the practical question: if you hold a plain S&P 500 fund, what bet are you actually making, how large is it, and what would genuinely dilute it? To set the scene, I plotted the combined weight of the ten largest S&P 500 holdings at five dated snapshots since 1990, with the same ten companies’ share of expected 2025 earnings marked against the end-2025 bar.
The effective number of stocks you own
Start with the raw material. State Street publishes the full holdings of SPY, the largest S&P 500 fund, every trading day. The file for 2026 lists 505 lines. Nvidia sits on top at 7.9 percent, Apple at 7.4, and the weights fall away fast from there: the 100th largest holding is already below 0.2 percent, and the smallest is a rounding error.
There is a standard way to compress a weight list like that into one honest number. Sum the squared weights, then take the reciprocal. Portfolio people call it the effective number of holdings, and it is the inverse of the Herfindahl index that antitrust economists use to measure market concentration. A fund with 505 equal slices would score 505. A fund with all its money in one stock would score 1. The number tells you how many equal-sized positions would produce the same concentration you actually hold.
Run that computation on the July 23 file and SPY scores 48.2. Merge Alphabet’s two share classes and count companies instead of lines, and the score drops to 45.2. Either way, the conclusion is the same. A fund that lists 505 stocks on the label carries the effective diversification of about 45 to 48 equal positions. Roughly nine tenths of the names in the fund are, in weight terms, decoration.
Two companion numbers from the same file make the shape of the thing concrete. The 25 largest lines are 50.9 percent of the fund, a majority of your money in 5 percent of the names. And the smallest 242 holdings, nearly half the list, together weigh 7.9 percent. That is less than Nvidia alone. If every company in the bottom half of the fund went to zero on the same afternoon, the damage would be about one Nvidia position. If Nvidia alone repriced by half, the damage would be larger than the bottom 200 companies could inflict in total.
None of this is a malfunction. Cap weighting holds companies in proportion to their market value, and market value is currently this lopsided. The point of computing the effective number is simply to replace a comforting label with a measurement. The label says 505. The measurement says about 48.
Ten names, one trade
Concentration alone would be a manageable story if the ten names at the top were ten independent bets. In 1972 the giants were a spread across film, autos, oil, retail, and computing. Today’s list is the part that deserves the most attention, because the top of the index is closer to one correlated position than at any point I can document.
Read the top ten lines of the July 23 holdings file: Nvidia, Apple, Microsoft, Amazon, Alphabet (twice, through two share classes), Broadcom, Meta, Micron, and Eli Lilly. Count companies and the drugmaker plus JPMorgan round out the ten. Eight of the ten largest companies in your index fund are priced substantially on the same question: does the buildout of artificial intelligence infrastructure earn a return? The narrower Magnificent Seven grouping alone is about 33 percent of the index as of 2026, per Slickcharts.
The cohort is coupled by an actual flow of money, which you can see in their own guidance. Amazon, Microsoft, Alphabet, and Meta have guided to roughly $725 billion of combined capital spending for 2026, per their early-2026 earnings calls. Most of that goes to data centers and the chips inside them, which is to say it lands on the income statements of Nvidia, Broadcom, and Micron, the three semiconductor names in the top ten. Inside your index fund, the four biggest buyers in that pipeline weigh about 15 percent and the three biggest sellers weigh about 13 percent. Add it up and roughly 28 cents of every SPY dollar sits on one side or the other of a single capital-spending stream, computed from the July 23 holdings file. The buyers’ stock prices assume the spending will pay off. The sellers’ stock prices assume the spending will continue. Both legs rest on the same underlying event.
Now put a price on the bet. The figure above shows the top ten at about 41 percent of index weight at end-2025, while representing 32 percent of expected 2025 earnings, per RBC Wealth Management’s 2026 analysis of FactSet data. Nine points of index weight, roughly a fifth of the whole position, reflects earnings that are expected but have not arrived yet. And the index carrying this structure trades at a Shiller CAPE of 40.7 as of 2026, a monthly reading exceeded only in 1999 and 2000. Concentration is a risk statement, never a return forecast: these companies are enormously profitable, and the bet may simply pay. The measured claim is narrower. A holder of the S&P 500 in 2026 has about a third of their money in one technology thesis, at a valuation with two precedents, and most holders never chose that sizing.
What actually dilutes the bet
The reflexive fix is “buy a broader fund,” and this is where the arithmetic gets clarifying, because some popular dilutions are cosmetic.
A total-market fund is the main cosmetic one. It holds thousands of stocks, and it is cap-weighted, so the added thousands arrive with the same microscopic weights that made the bottom half of SPY decorative. The S&P 500 is roughly four fifths of US market value, so moving from an S&P 500 fund to a total-market fund scales the top ten from 37.7 percent down to about 30 percent. That is a real haircut, and a modest one. The same ten names still dominate, in the same order, driven by the same thesis. Adding 3,000 stocks bought you back about a fifth of the bet.
Equal weight is a real dilution. An equal-weight S&P 500 fund holds the same companies at about 0.2 percent each, which puts the top ten near 2 percent and pushes the effective number of holdings to the full count by construction. The trade-off is genuine and I have measured it before: equal weight tilts toward smaller, more cyclical companies, it was the more volatile version across most of the last two decades, and it lags badly in every year the giants lead. You are exchanging one risk for another with open eyes, which is the only honest way to exchange risks.
International is the other real dilution, and it works by simple scaling. Move 30 percent of your equity allocation to a non-US fund and every US weight gets multiplied by 0.7. Nvidia falls from 7.8 percent of your stock money to about 5.5 percent, the AI cohort from roughly a third to under a quarter. No forecast is embedded in that move, just arithmetic, which is exactly why it is dependable.
The common thread: dilution you can verify beats dilution you can name. Count the effective holdings of whatever you would switch to. If the number barely moves, the switch is a relabeling.
Know what you own
Here is where I am obligated to disappoint anyone hoping this ends with “sell your index fund.” It does not, and the reasoning is in the numbers already on the table.
Cap-weighted indexing has carried this much concentration before, in 2000, and the index investor who simply kept buying through the unwind did fine over any long horizon. The equal-weight and international alternatives are legitimate and they spent most of the 2010s and 2020s trailing, sometimes painfully. Meanwhile the concentrated cohort is concentrated precisely because it earns a staggering share of American profits: 32 percent of expected 2025 earnings is an understated-sounding number that no previous leadership group matched at comparable weight. A bet can be large, correlated, expensive, and still win. The 1990s taught expensive lessons to people who treated concentration as a sell signal, and the top-10 weight touched 27 percent in 2000 well before the actual top.
What the numbers do demand is that you stop describing the position inaccurately. “I just own a diversified index fund” was a fair description of the S&P 500 in 2015, when the top ten were 19 percent and the effective count was well over a hundred. In 2026 the accurate description is: a portfolio with the effective diversification of about 48 positions, a third of it in one technology thesis, priced at the second-richest valuation in 145 years of data. You may be entirely comfortable with that position. Plenty of informed people are. Comfort should just follow from the description, never from the label.
The practical checklist is short. Know your effective exposure: if the S&P 500 is your whole equity allocation, a third of your stock money is an AI position, dated 2026, and it will drift as the leaders drift. Size the bet deliberately, using the two dilutions that are real, equal weight and international, if the current sizing exceeds what you would choose on purpose. Rebalance on schedule, because in a cap-weighted fund the winners size themselves up automatically and rebalancing is the only counterweight you control. And date your numbers, because every one in this article will be wrong eventually. Concentration fell for fifteen straight years after 2000. Nothing here is a one-way ratchet, which is exactly why it rewards measuring over remembering.
The index fund is still the best default vehicle retail investors have ever been handed. It is just no longer a neutral one. As of 2026, buying the market means buying the AI trade at about a one-third weight. Buy it if you mean it.
Sources
- State Street Global Advisors, SPDR S&P 500 ETF Trust (SPY) daily holdings file, holdings as of 2026 (ssga.com); effective number of holdings, top-25 weight, and cohort weights computed from it.
- stockanalysis.com, SPY holdings and weights as of 2026 (top ten 37.7 percent; Nvidia 7.8 percent, Apple 7.6 percent).
- RBC Wealth Management, “The ‘Great Narrowing’: S&P 500 concentration,” 2026 (RBC/FactSet: top-10 weight about 19 percent in 1990, about 27 percent at the 2000 peak, about 19 percent in 2015, about 41 percent at end-2025; top-10 share of expected 2025 earnings about 32 percent).
- Slickcharts, Magnificent Seven share of S&P 500 weight, accessed 2026 (about 33 percent).
- Company earnings calls: Amazon (2026), Microsoft (2026), Meta (2026), and Alphabet (2026), combined 2026 capital expenditure guidance of roughly $725 billion.
- multpl.com, Shiller PE ratio monthly reading, 2026 (40.7), extending Robert J. Shiller’s dataset (econ.yale.edu/~shiller).