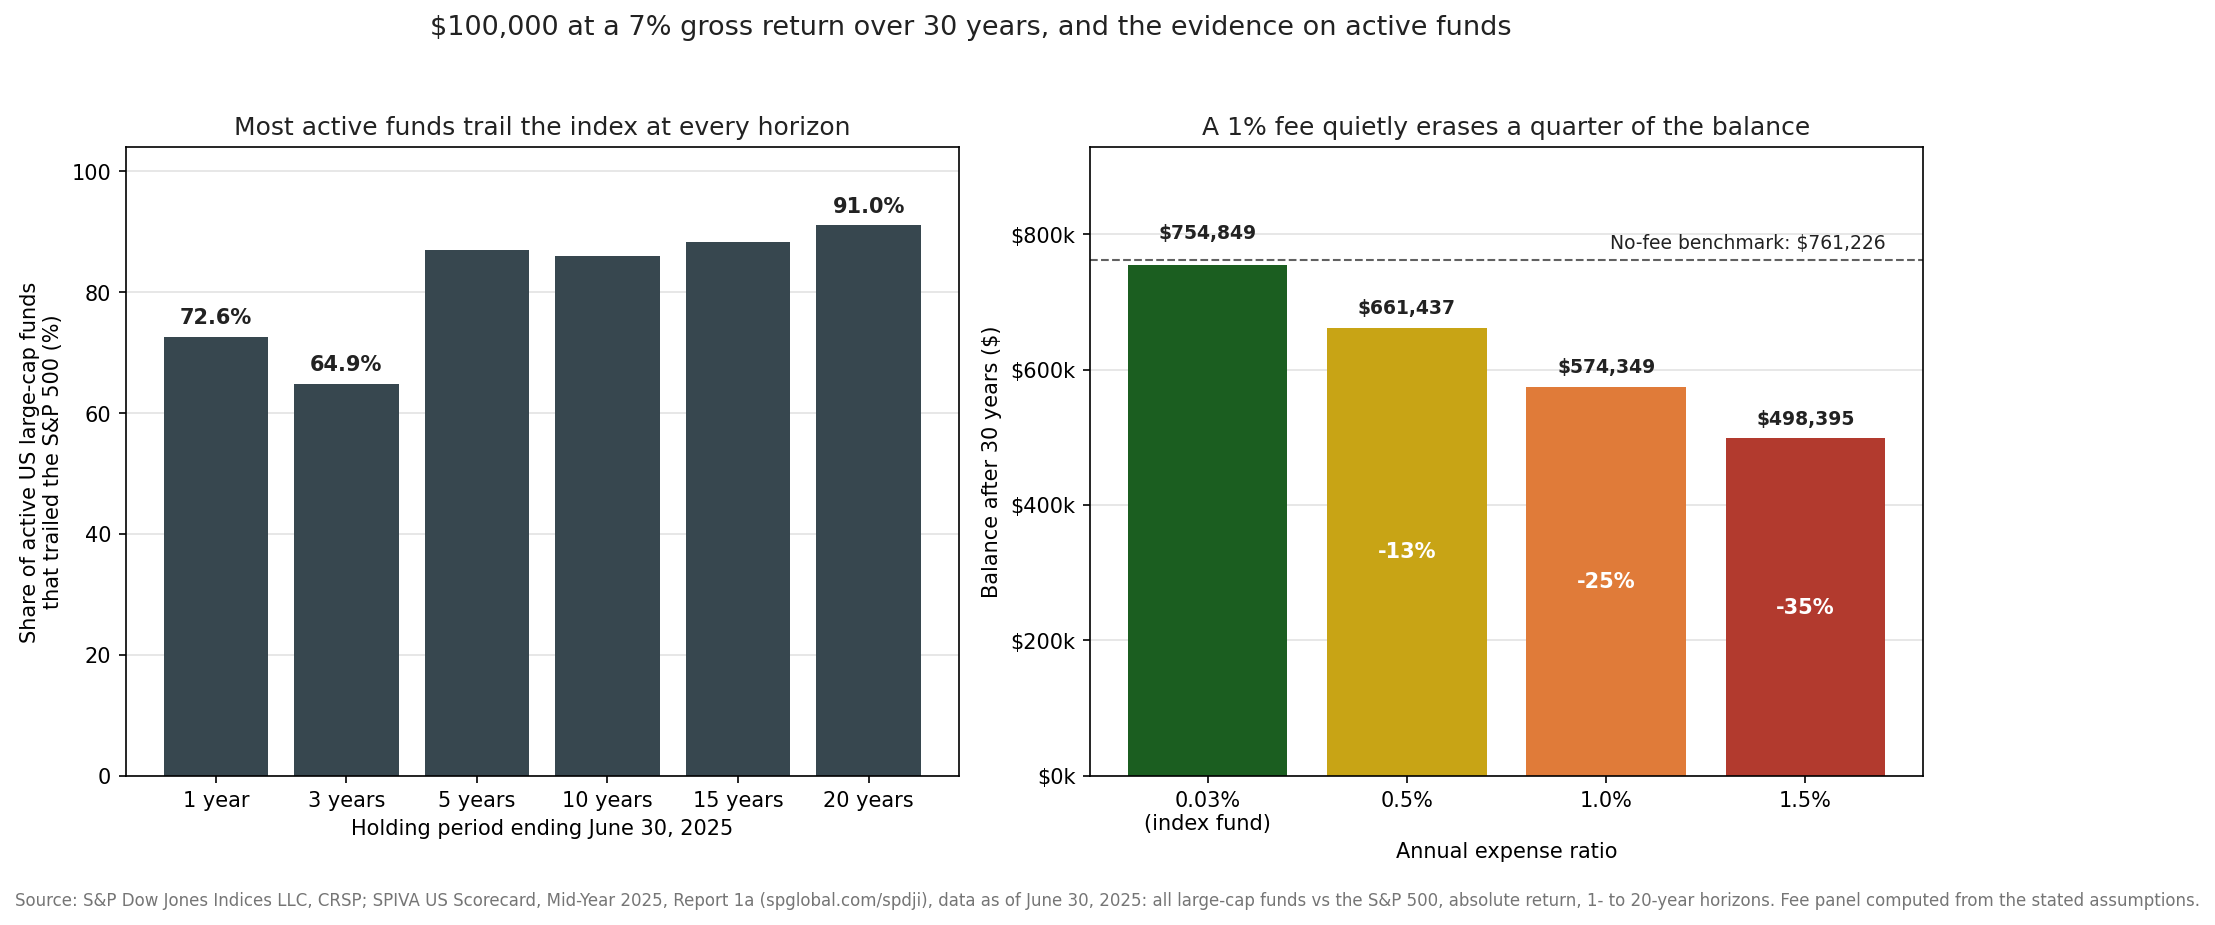
A 1 percent annual fund fee sounds like a rounding error. On 100,000 dollars invested for 30 years at a 7 percent gross return, it quietly removes about 187,000 dollars, close to a quarter of the entire balance. That is not the fund losing money. That is the fee compounding against you every year, in the background, whether the fund does well or badly.
Most investors check a fund’s past performance and ignore its expense ratio, which is exactly backwards. Past performance is noisy and rarely repeats. The expense ratio is the one number on the page that is guaranteed, contractual, and paid every single year. It is the closest thing in investing to a known quantity, and it points in one direction only.
I want to make two things concrete here. The first is how a small annual fee turns into a large loss over a lifetime. The second is the evidence on what you get in return for paying up, which comes from the most systematic study of active funds that exists.
A Fee Is a Negative Return That Never Stops
Start with the expense ratio itself. A fund’s expense ratio is the percentage of your money the fund company takes each year to run the fund, deducted quietly from the fund’s assets so you never see a bill. A broad index fund might charge 0.03 percent. A traditional active fund might charge 1 percent or more. The gap looks trivial on a single statement and is anything but trivial over time.
Think of the fee the way a control engineer thinks about a leak in a feedback loop. Your portfolio compounds on itself, so every dollar the fee removes this year is also a dollar that cannot compound next year, and the year after, and for every year that follows. The loss is not the fee. The loss is the fee plus all the growth that fee would have produced.
The figure in this article makes the size of the leak visible. Take 100,000 dollars, a 7 percent gross return, and 30 years. With no fee at all, that grows to about 761,000 dollars. Run the same money through a 0.03 percent index fund and you end with about 755,000 dollars, having given up roughly 6,000 to costs. Run it through a 1 percent fund instead and you end with about 574,000 dollars. The fee took 187,000 dollars, which is 24.5 percent of the no-fee result. Push the fee to 1.5 percent, a level that was once common, and the ending balance drops to about 498,000 dollars, a loss of 35 percent.
Sit with that comparison for a moment. The 1 percent fund and the 0.03 percent fund hold broadly similar assets and face the same market. The only reliable difference between them is the fee, and that single difference is worth about 180,000 dollars over a career. The expensive fund charged roughly 29 times what the index fund charged, and the compounding turned that into an enormous gap in what you keep.
This is why the fee matters more the longer you invest, and it is precisely the opposite of how people weigh it. A young investor with 40 years ahead has the most to lose from a high fee and usually pays the least attention to it. The fee is small when you are looking at one year. It is decisive when you are looking at a lifetime.
The Evidence on What Paying More Buys You
A defender of active funds would say the fee is worth it, because a skilled manager earns back the cost and more. That is a testable claim, and it has been tested about as thoroughly as anything in finance.
S&P Dow Jones Indices publishes a scorecard called SPIVA, short for S&P Indices Versus Active. Twice a year it measures what share of actively managed funds beat their benchmark index over various horizons. It is the most systematic public study of active fund performance that exists, and it is not kind to the active industry. The left panel of the figure shows the pattern for US large-cap funds measured against the S&P 500, taken directly from Report 1a of the SPIVA US Scorecard, Mid-Year 2025, for periods ending June 30, 2025.
Over the single year to that date, 72.6 percent of active US large-cap funds trailed the S&P 500. Over 3 years the figure was 64.9 percent, over 5 years 86.9 percent, over 10 years 86.0 percent, over 15 years 88.3 percent, and over 20 years 91.0 percent. Note the shape honestly: it is not a clean staircase. The 3-year number is the lowest of the six, and the 10-year number sits marginally below the 5-year one. Short horizons swing with whatever the market happened to reward in that stretch. What does not swing is the long end. At every horizon a clear majority of funds lost, and by 20 years roughly nine in ten had.
Read the long end carefully, because it inverts the usual intuition. People assume that skill shows up over time and that a good manager pulls ahead as the years accumulate. The data show the reverse. Time is the enemy of the active fund, not its friend, because the fee compounds every year while the occasional stretch of good stock picking does not repeat reliably. These are the figures from one named edition, and the short-horizon ones move from report to report. The long-horizon result is the stable one.
There is a further trap hiding in any list of past winners, and it is called survivorship bias. Funds that perform badly get closed or merged away, so they quietly vanish from the record. When you look at the funds that still exist after 20 years, you are looking at the survivors, which flatters the group. The SPIVA scorecards correct for this by counting the funds that started the period, including the ones that died along the way. The true survival-adjusted numbers are worse than a naive look at today’s fund menu would suggest.
Why the Odds Are Built This Way
None of this requires believing that active managers are foolish. Many are talented. The problem is structural, and the cleanest statement of it came from the Nobel laureate William Sharpe in a short 1991 essay called “The Arithmetic of Active Management.”
Sharpe’s argument is almost too simple to argue with. All the investors in a market together own the whole market, so their combined return, before costs, must equal the market’s return. Passive investors hold the market and match it by design. That means the active investors, as a group, must also match the market before costs, because the two groups together make up the whole. Once you subtract the higher fees and trading costs that active management requires, the active group as a whole must trail the market by the amount of those extra costs. This is arithmetic, not a theory that can be disproven by a clever manager.
Individual managers can and do beat the market in any given period. The arithmetic only says that they cannot all do it, and that the average active dollar must lose to the average passive dollar by roughly the difference in costs. The SPIVA data are what that arithmetic looks like once it plays out across thousands of real funds and many years.
The catch for you as a buyer is that skill and luck look identical in the short run. A fund can beat the index for three or five years on luck alone, attract a flood of new money on the strength of that record, and then revert. Persistence studies from S&P Dow Jones Indices show that last period’s top-quartile funds rarely stay in the top quartile, which is what you would expect if much of the outperformance was noise. Picking tomorrow’s winning fund from today’s leaderboard has been close to a coin flip, and the coin costs you 1 percent a year to hold.
What This Actually Means for You
The practical takeaway is not that active management is evil or that no manager ever adds value. It is that the fee is a near-certain cost and the outperformance is a long-shot bet, so the expected trade is a bad one for most people most of the time.
A few concrete habits follow from the numbers. Check the expense ratio before you check the past returns, because the fee is the part you can actually predict. Treat any figure above roughly 0.2 percent for a broad stock fund as a red flag that needs a reason. Understand that a 1 percent advisory or fund fee is not competing with zero, it is competing with the low-cost index fund that would have captured the market return for a few hundredths of a percent, and over decades that competition is not close.
The deeper point is about where your energy should go. The market’s return is outside your control and roughly the same whether you are clever or not. The fee is entirely inside your control, and unlike the market it compounds in a direction you can choose. Cutting a fund’s cost from 1 percent to 0.03 percent is one of the few moves in investing that is close to free money, available to anyone, requiring no forecast and no skill. You just have to read the one number most people skip.
Sources
- S&P Dow Jones Indices LLC, CRSP. SPIVA U.S. Scorecard, Mid-Year 2025, Report 1a, “Percentage of U.S. Equity Funds Underperforming Their Benchmarks (Based on Absolute Return),” row “All Large-Cap Funds” vs the S&P 500. Data as of June 30, 2025. https://www.spglobal.com/spdji/en/documents/spiva/spiva-us-mid-year-2025.pdf
- William F. Sharpe, “The Arithmetic of Active Management,” Financial Analysts Journal, 1991.
- Fee-drag figures computed for a 100,000 dollar balance over 30 years at a 7 percent gross return, across various expense ratios.
- Morningstar, annual fund fee studies on average asset-weighted expense ratios, for context on typical index vs active costs.