In software engineering, an infinite loop has a specific signature: the exit condition is never reached because it is either missing or unsatisfiable. A while (wealth < "Rich") loop runs forever because “Rich” is an undefined string that moves with every comparison. There is no termination condition. The process never exits.
Most people run this loop with their financial lives.
They want to be “rich.” They work harder. Income rises. Spending rises to match. The target adjusts upward. The loop continues. At no point does the program evaluate True for the exit condition, because the exit condition was never defined. The loop does not terminate. It runs until the hardware fails, which in biological terms means retirement forced by age or illness, not chosen from a position of strength.
Vicki Robin, in Your Money or Your Life, identified the fix in 1992. The fix is not earning more, or cutting more, or investing more cleverly. The fix is replacing the undefined variable “Rich” with a precisely defined target variable called “Enough.” The loop can only terminate when the exit condition has a value. “Enough” has a value. “Rich” does not.
The Fulfillment Curve
Robin’s central insight is that the relationship between spending and fulfillment is not linear. It is an inverted U. There are three distinct zones on the curve:
Zone 1 (Survival): The early dollars spent on basic needs generate a massive return in fulfillment. Each dollar of food, shelter, and safety converts almost directly into wellbeing. The derivative dH/dE is steep and positive: every dollar generates roughly one unit of happiness. This zone runs from $0 to approximately $25,000–$35,000 per year in modern developed economies.
Zone 2 (Comfort): Additional spending on convenience, quality, and experiences continues to increase fulfillment, but the slope flattens. The derivative is still positive but decreasing. A better apartment genuinely adds quality of life. A decent car is better than an unreliable one. Business class on an overnight flight is meaningfully better than economy. The returns are real but diminishing. This zone roughly spans $25,000–$70,000 per year.
Zone 3 (Clutter): Beyond a certain point, the curve inverts. Additional spending begins to reduce fulfillment. The boat requires maintenance, insurance, and scheduling, all of which consume time and produce stress. The larger house requires cleaning, staff, and heating costs that occupy mental bandwidth. The premium subscriptions and memberships sit unused. Spending beyond the peak delivers negative marginal fulfillment, not zero. It introduces obligations, maintenance burdens, and complexity that erode the wellbeing the spending was supposed to produce.
The chart below traces the curve across all three zones and marks where the peak sits.
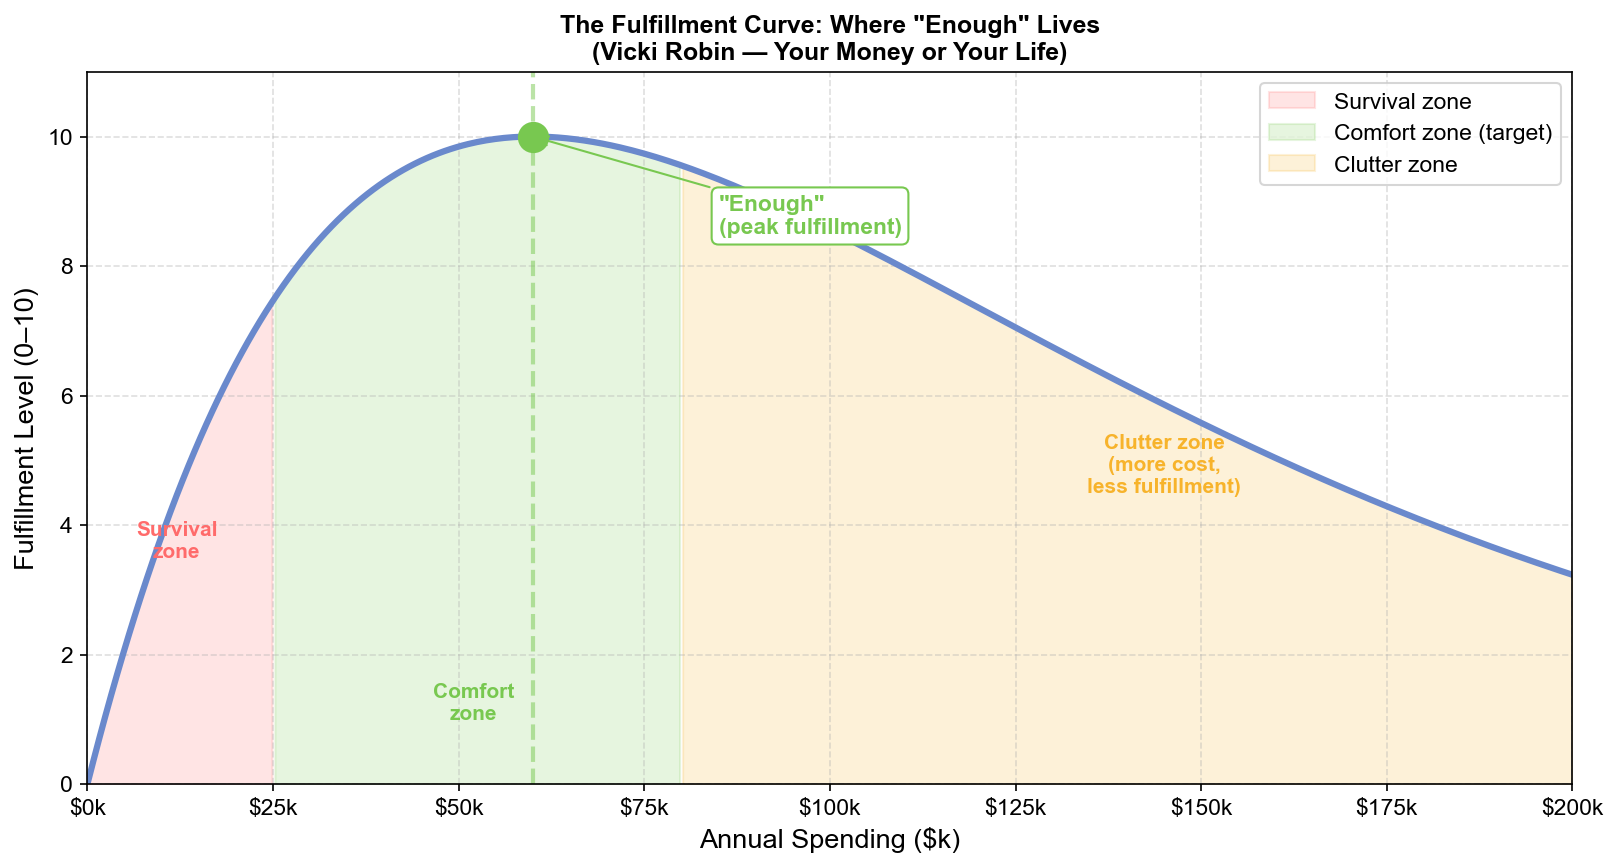
The peak of the curve (the point where one more dollar of spending produces zero marginal fulfillment before starting to go negative) is “Enough.” It is a local maximum. Its position is individual, but the shape of the curve is universal.
Where Does “Enough” Actually Sit?
The academic research on the income-to-wellbeing relationship converges on a range that surprises most engineers living in high-cost metros.
Kahneman and Deaton’s 2010 study (one of the most cited papers in behavioral economics) found that emotional wellbeing (day-to-day reported happiness) plateaus at approximately $75,000 per year in 2010 dollars. Beyond that level, emotional wellbeing did not improve with additional income. Life evaluation (how people rate their lives overall) continued to increase with income, but at diminishing rates.
A 2021 reanalysis by Matthew Killingsworth using a much larger dataset found continued wellbeing gains into the $500,000 range, but the gains flattened significantly: a much smaller increment of wellbeing per additional dollar at $300,000 than at $80,000.
The consistent finding across all the research: the curve is steep in the survival and comfort zones, and flat or inverted in the clutter zone. The transition point, the Zone 2 to Zone 3 boundary, is somewhere between $75,000 and $150,000 for a household in a moderate cost-of-living environment, indexed for inflation and geography.
For a senior engineer in a high-cost city (San Francisco, Seattle, New York), the “Enough” number is higher because the cost of the survival and comfort zones is higher. But the shape of the curve does not change. The inversion still happens, and it happens well below the compensation levels that tech careers commonly deliver.
The Scope Creep Mechanism
Why do most high earners continue spending well past the Enough peak? The same behavioral mechanisms that produce the Diderot Effect and Hedonic Treadmill are responsible here, but there is a third factor: scope creep driven by social comparison.
In software project management, scope creep is the gradual expansion of requirements beyond the original specification, not because the additional features are needed but because they seem adjacent and achievable given current resources. Each individual addition seems justified. The aggregate is an unshippable product.
Financial scope creep works the same way. Each individual upgrade (the nicer apartment, the better car, the premium gym, the finer restaurants) seems justified given the current income level. Each one passes the “can I afford this?” test. None of them is evaluated against the Fulfillment Curve. The question never asked is: “Does this move me toward the peak or past it?”
For engineers earning $300,000 to $500,000, almost every lifestyle upgrade is past the peak. They are spending in the Clutter zone. The spending is not producing meaningful additional wellbeing. It is producing complexity, obligation, maintenance burden, and the chronic low-grade stress of managing a high-cost lifestyle. And it is extending the financial independence timeline by years for each $10,000 increment of annual spending added.
Defining Your “Enough” Number
The exercise Robin recommends is practical and non-trivial: map your own fulfillment curve. For every major category of spending, ask honestly:
Does this spending sit in my Comfort zone (genuine positive contribution to wellbeing), or has it crossed into my Clutter zone (zero or negative marginal return)?
The categories where engineers most commonly discover they are in the Clutter zone:
- Housing above a certain size and location premium. Once the commute is manageable and the space is not cramped, additional bedrooms, premium neighborhoods, and home features deliver near-zero marginal wellbeing in studies of residential satisfaction.
- Vehicle quality beyond reliability and comfort. The research on driving experience, referenced in the Man in the Car Paradox, shows correlation effectively at zero between vehicle market value and driver enjoyment.
- Subscription and membership accumulation. Each subscription passes the affordability test individually; in aggregate they are often more anxiety-producing than enjoyment-producing.
- Restaurant and entertainment spending above a certain frequency. Occasional experiences in the comfort zone. High-frequency experiences in the clutter zone (adapted baseline, no novelty signal, but the cost persists).
The Enough number for most engineers in this exercise is lower than their current spending, not higher. The gap between actual spending and Enough is the amount available for redirection to savings, and therefore the lever that most directly controls the position on the Freedom Velocity Curve.
Defining the Loop Exit Condition
The practical output of the Fulfillment Curve analysis is a specific annual spending figure, the Enough number, that serves as the fixed target for the financial independence calculation.
Enough = annual spending at the peak of your personal fulfillment curve
FI Target = Enough × 25  (Rule of 25 at 4% withdrawal rate)
This number is not aspirational. It is not what you currently spend or what you expect to spend if income increases further. It is the spending level above which you are in the Clutter zone, past the peak of the curve, buying maintenance burden instead of wellbeing.
The loop exit condition is now defined. The program can terminate. The target is not “Rich,” an infinite string. The target is a specific portfolio value equal to 25 times your Enough number. When the portfolio reaches that value, the loop condition evaluates True, and the program exits.
Until the Enough number is defined, the loop cannot exit. Every income increase feeds a larger lifestyle, which advances a larger target, which extends the required accumulation period, which requires more income, which extends the timeline indefinitely. The loop runs until the hardware fails.
Defining Enough is not a financial planning step. It is the prerequisite to financial planning. Without it, every savings rate calculation, every investment allocation decision, and every income optimization effort is optimizing a system without a known exit condition. You cannot reach a target you have not defined.
Define Enough first. Everything else follows.
This article is adapted from Chapter 4 of Debugging Your Personal Finance, which develops the Fulfillment Curve into a formal target-variable definition framework. The chapter derives the Rule of 25 from William Bengen’s SAFEMAX research and introduces the Freedom Matrix, a sensitivity analysis showing exactly how much capital each spending level requires under different withdrawal rate assumptions.