The sticker price on a vehicle is the wrong unit of measurement. It is denominated in dollars, which gives it the appearance of precision, but it measures the wrong quantity. The relevant currency for a financial decision is not dollars. It is time. Specifically, years of mandatory working life: the number of additional years you must remain employed to fund the choice you are about to make.
When you restate purchase decisions in that currency, the decision landscape changes completely. And no category of purchase reframes more dramatically than the vehicle choice most engineers make in their thirties.
The Rule of 25: Converting Spending Into Capital Requirements
The foundation of the Freedom Cost Matrix is William Bengen’s SAFEMAX research, the most rigorous study of sustainable withdrawal rates from a retirement portfolio. Bengen’s analysis of historical market data established that a portfolio can sustain a 4% annual withdrawal rate indefinitely across all historical return sequences, including the worst decades on record.
The inverse of the 4% rule is the Rule of 25: every dollar of permanent annual spending requires $25 in portfolio capital to sustain. This is not a rough estimate. It is a derivation from the withdrawal rate that has survived every historical market regime for which data exists.
The Rule of 25 converts any spending decision into a capital requirement:
Additional Capital Required = Annual Spending Increase × 25A $10,000 annual spending increase requires $250,000 in additional portfolio capital. A $5,000 increase requires $125,000. The multiplier is fixed, and it applies to every permanent lifestyle upgrade: vehicles, housing, subscriptions, dining, memberships. Each one requires 25 times its annual cost in additional capital before you can stop working.
Building the Freedom Cost Matrix
The Freedom Cost Matrix applies the Rule of 25 to vehicle total cost of ownership (TCO), the full annual cost of owning and operating a vehicle, including depreciation, insurance, maintenance, fuel, and financing. TCO is the correct measure because it captures the full annual obligation, not just the purchase price.
The baseline is the Toyota Corolla, a reliable utility vehicle with a TCO of approximately $5,000 per year. Every other vehicle in the matrix is measured against this baseline. The question is not “what does this vehicle cost?” but “what does this vehicle cost above the baseline?” That is the status premium, expressed in annual dollars.
| Vehicle | TCO/year | Premium over Baseline | Capital Required (×25) | Time to Accumulate* |
|---|---|---|---|---|
| Toyota Corolla (Baseline) | $5,000 | — | — | 0.0 years |
| Honda Civic | $7,500 | $2,500/yr | $62,500 | 2.9 years |
| BMW 3 Series | $14,000 | $9,000/yr | $225,000 | 8.6 years |
| Porsche 911 | $22,000 | $17,000/yr | $425,000 | 13.4 years |
Saving $20,000/year at 7% real return until the required capital is accumulated.
The chart below turns that final column into a picture.
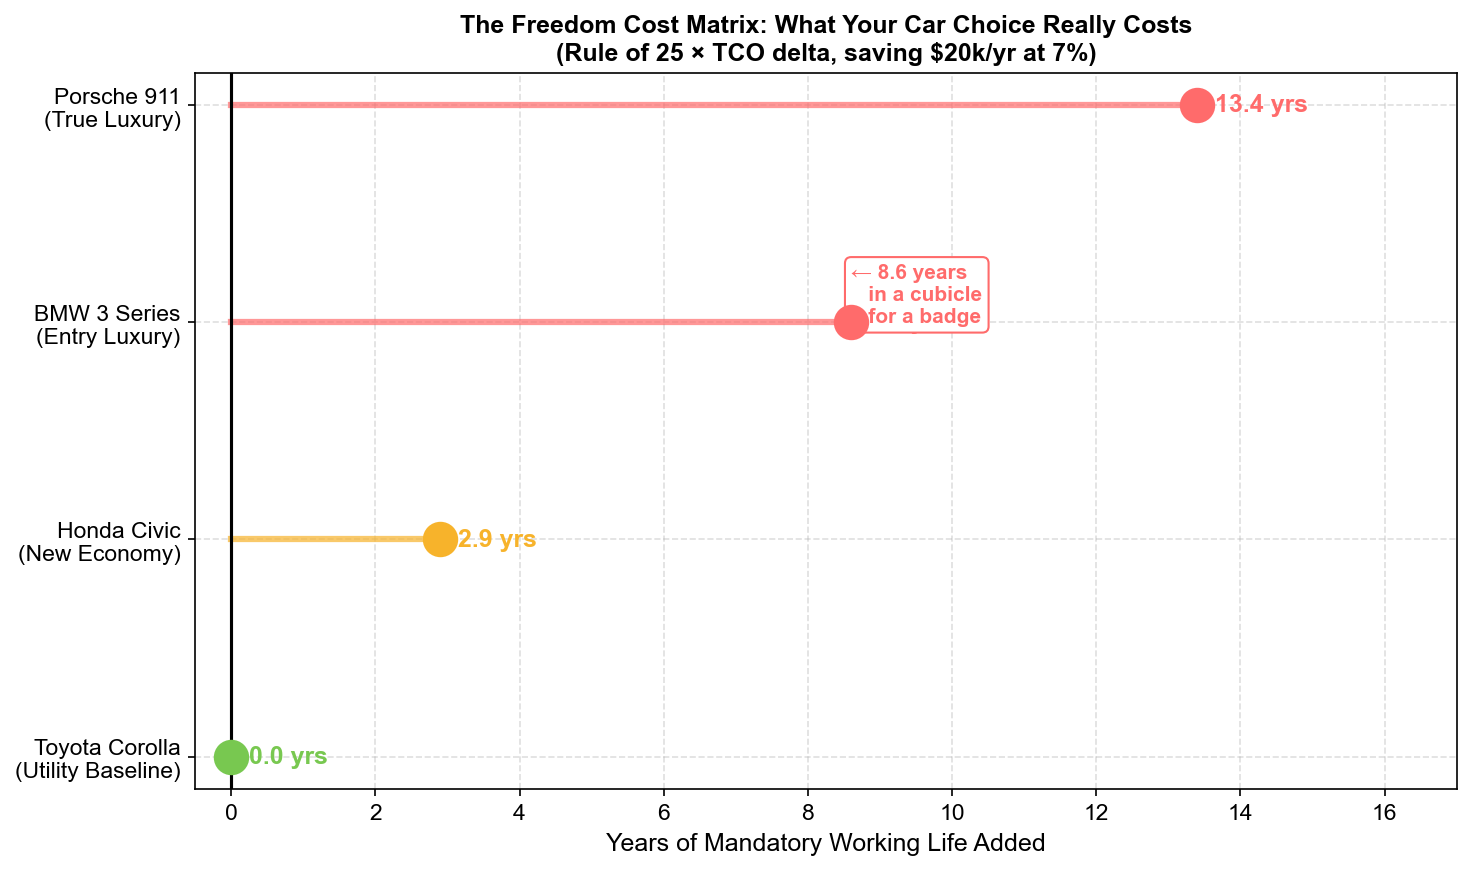
The lollipop chart makes the data immediate: the Porsche 911 extends to 13.4 years. That is not a large number in an abstract sense. It is a decade and a half of mandatory alarm clocks, performance reviews, and employment dependency, purchased for the right to drive a specific badge.
The BMW Derivation, Step by Step
The 8.6-year figure for the BMW 3 Series is not a round number or an approximation. Here is the full derivation.
Step 1: Establish the annual TCO premium. BMW 3 Series TCO: approximately $14,000/year (insurance ~$2,400, maintenance ~$1,600, depreciation ~$8,200 on a 51% five-year value loss, financing costs on a $55,000 purchase). Toyota Corolla TCO: approximately $5,000/year. Annual premium: $14,000 − $5,000 = $9,000/year.
Step 2: Apply the Rule of 25. To fund a permanent $9,000/year spending obligation from a portfolio: $9,000 × 25 = $225,000 in additional capital required.
Step 3: Calculate accumulation time. At a $20,000/year savings rate and 7% real return, the time to accumulate $225,000:
$225,000 = $20,000 × ((1.07^t - 1) / 0.07)
Solving: t ≈ 8.6 years
The BMW badge costs 8.6 years of mandatory working life.
This is the question the dealership never poses: is the badge on the hood worth staying employed until you are 59 instead of 50? The sticker price does not capture this. The Rule of 25 does.
The Matrix Generalizes to All Spending
The Freedom Cost Matrix is not a framework specific to vehicles. It is a universal conversion tool for any permanent spending increase.
A housing upgrade from a $3,500/month mortgage to a $5,500/month mortgage adds $24,000 per year in permanent spending. Multiply by 25: $600,000 in additional capital required. At a $20,000 savings rate and 7% return, that is approximately 20 additional years of mandatory employment, for a larger house in a better zip code.
A restaurant habit upgrade, from $400/month to $800/month in dining, adds $4,800 per year. Capital required: $120,000. Time: 5.2 years.
A country club membership at $12,000/year: capital required $300,000. Time: 11.2 years.
None of these calculations argue that the spending is wrong. They argue that the spending has a price that most people have never computed, denominated in the currency that actually measures what is being traded. You are trading years of your working life. The question is whether each trade is worth it at the price the Rule of 25 reveals.
The Corolla as a Time Machine
The Freedom Cost Matrix reframes the Toyota Corolla from a boring default choice into an active decision with compounding consequences.
The engineer who drives a Corolla instead of a BMW does not just save $9,000 per year. They do two things simultaneously: they reduce the capital required to achieve financial independence (by $225,000), and they increase their annual savings rate by $9,000, which compounds toward that reduced target faster.
The combination is nonlinear. Reducing the target by $225,000 while simultaneously increasing annual savings by $9,000 moves the financial independence date not by 8.6 years in a simple additive sense. It moves it by more, because each additional saved dollar reduces the gap while compounding forward.
The Corolla is a time machine in the literal sense: it purchases years of life back from mandatory employment and reallocates them to discretionary use. The BMW is a time machine running in the opposite direction.
Running Your Own Freedom Cost Matrix
The calculation for any purchase follows the same three-step protocol:
Step 1: Annual cost delta = Annual cost of upgrade − Annual cost of baseline
Step 2: Capital required  = Annual cost delta × 25
Step 3: Years of work     = Time to accumulate (Capital required) at your savings rate and 7%
For step 3, if the accumulation time formula is unfamiliar, a useful approximation: at a $20,000 savings rate and 7% return, every $100,000 in required capital costs approximately 3.8 years. The BMW’s $225,000 requirement is approximately 2.25 × 3.8 = 8.6 years, consistent with the exact calculation.
The question to ask before every major lifestyle upgrade is not “can I afford the monthly payment?” That question is answerable with almost any income at almost any level of borrowing. It is the wrong abstraction layer.
The question is: how many years of mandatory working life am I willing to trade for this?
If the answer is less than what the Freedom Cost Matrix calculates, the upgrade is a bad trade by your own stated preferences. If the answer is more, if 8.6 years of additional employment is genuinely worth a BMW to you, then the trade is yours to make. The matrix does not prohibit spending. It requires you to price it correctly.
This article is adapted from Chapter 2 of Debugging Your Personal Finance, which derives the full Freedom Cost Matrix alongside the commute tax and fragility framework. Chapter 12 extends this into a 30-year compound simulation showing exactly how a single vehicle choice reshapes the terminal wealth trajectory.