The 4 percent rule survived all but one 30-year period in a century of US market history. That single failure tells you exactly where the rule breaks and why.
Here is the rule in one sentence. In the first year of retirement you withdraw 4 percent of your portfolio’s starting value, and every year after that you spend the same dollar amount plus inflation, ignoring what the market does. Start with a million dollars and you take out 40,000 dollars in year one. If inflation runs 3 percent, year two you take out 41,200 dollars, and so on for 30 years. The claim is that a portfolio of US stocks and bonds has a high chance of outlasting that spending schedule.
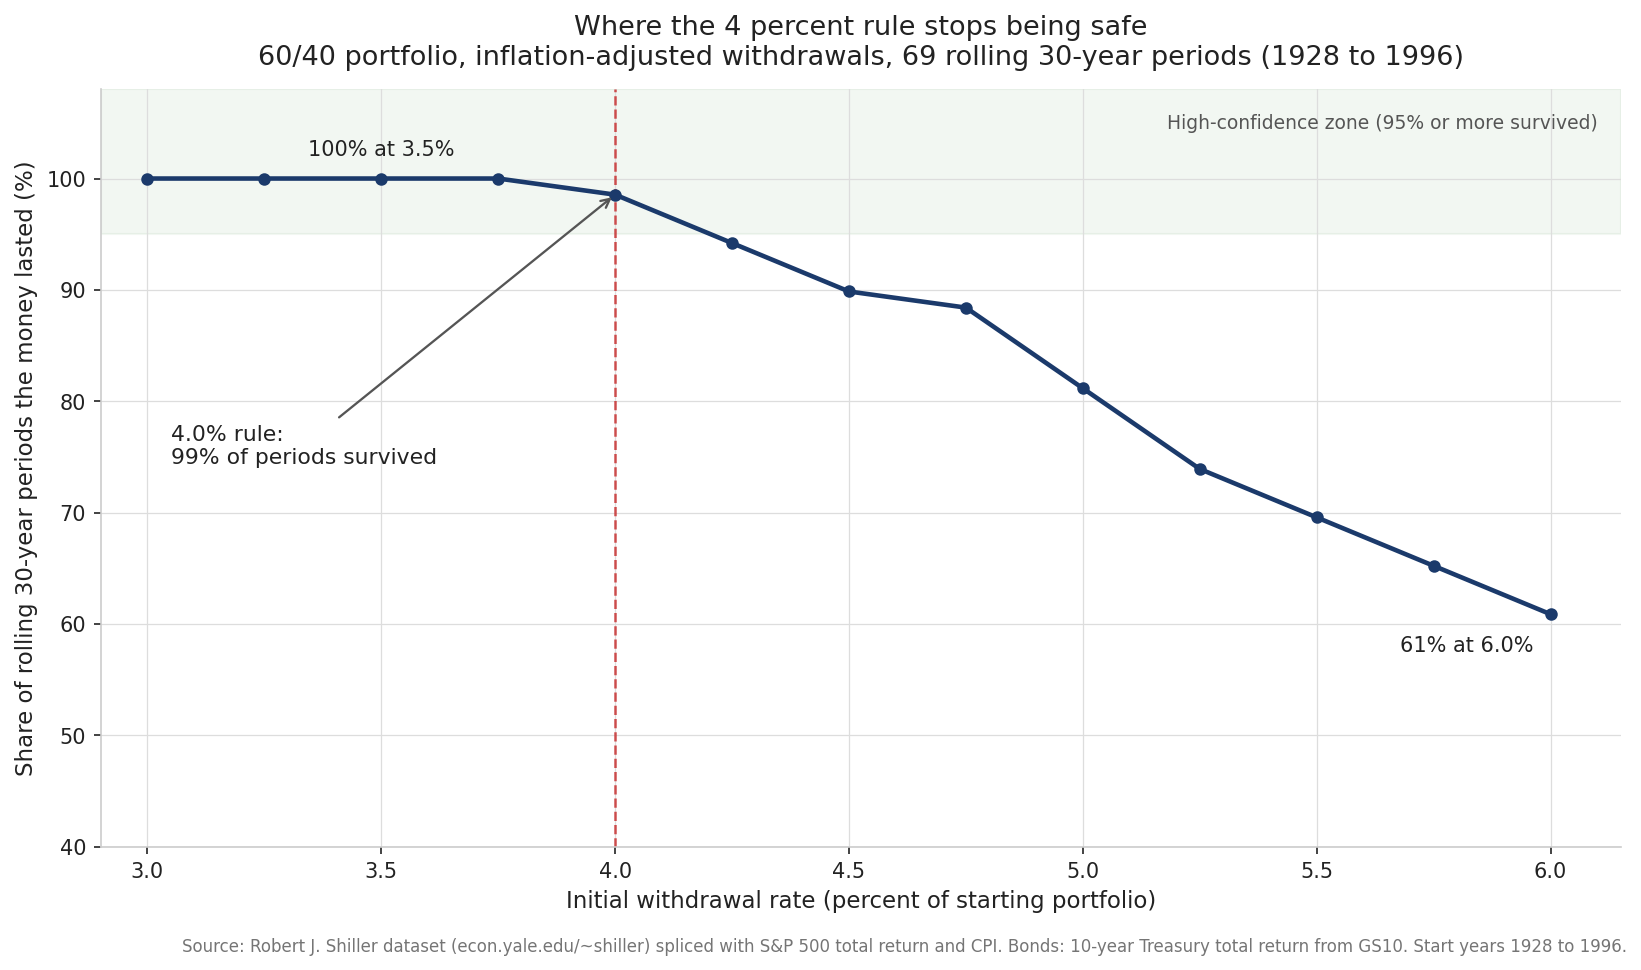
It is one of the most repeated numbers in personal finance, and most of the time it is quoted without any of the conditions that make it true. The rule is a solid starting estimate. It was never a 45-year plan, it was never tested outside the United States, and it was never a guarantee. To see where the edges are, it helps to know where the number actually came from and to rebuild the historical record it rests on. I rebuilt that record from nearly a century of US market data, and here is the survival curve that came out.
Where the 4 percent came from
The number is not folklore. It has an author and a date.
In October 1994, a financial planner named William Bengen published a paper in the Journal of Financial Planning called “Determining Withdrawal Rates Using Historical Data.” Bengen did something that sounds obvious now and was uncommon then. He took actual US market history, stock returns and intermediate government bond returns going back to 1926, and asked a mechanical question. For a retiree who started in each historical year and withdrew a fixed inflation-adjusted amount, what is the highest first-year withdrawal rate that never ran the money dry inside 30 years, even for the person unlucky enough to retire at the worst possible moment? His answer was close to 4 percent. He called that worst-case survivor rate the safe withdrawal rate.
Four years later, in 1998, three finance professors at Trinity University in San Antonio, Philip Cooley, Carl Hubbard, and Daniel Walz, published “Retirement Savings: Choosing a Withdrawal Rate That Is Sustainable” in the AAII Journal. They ran the same style of test across many stock and bond mixes and many withdrawal rates and reported the share of historical periods each combination survived. Their paper is where the phrase “success rate” attached to withdrawal planning, and it is the reason people now call this idea the Trinity Study. Both papers pointed at the same conclusion. Around 4 percent, inflation-adjusted, a US stock-and-bond portfolio held up across the historical record for 30 years.
Read that last sentence slowly, because every clause in it is a boundary condition. Inflation-adjusted spending. A US portfolio. A 30-year horizon. Change any one of those and the 4 percent number stops being the answer to the question you are actually asking.
What the historical record actually shows
I rebuilt the test from scratch so the conditions are explicit and the numbers are auditable.
I built a 60/40 portfolio, 60 percent US stocks and 40 percent bonds, rebalanced every month. The stock leg is the S&P 500 total return with dividends reinvested, from Robert Shiller’s monthly dataset (econ.yale.edu/~shiller) spliced with the official S&P 500 total-return index for the recent tail. The bond leg is a 10-year Treasury total return, built each month from the coupon plus the price change implied by that month’s move in the 10-year yield. Then I ran the Bengen mechanic. For every rolling 30-year period that begins in a calendar year from 1928 onward, I let the portfolio earn its real returns and withdrew an inflation-adjusted amount each year, checking whether the money lasted the full 30 years. That gives 69 overlapping periods, the earliest starting in 1928 and the latest starting in 1996, the last year with a complete 30 years of data running into early 2026.
The survival record, by first-year withdrawal rate, comes out like this.
- 3.0 percent lasted 30 years in 69 of 69 periods, a perfect 100 percent.
- 3.5 percent also lasted in 69 of 69 periods, 100 percent.
- 4.0 percent lasted in 68 of 69 periods, 98.6 percent, with a single failure.
- 4.5 percent lasted in 62 of 69 periods, 89.9 percent.
- 5.0 percent lasted in 56 of 69 periods, 81.2 percent.
The figure above plots that whole curve out to 6 percent, and the shape is the point. From 3 to 4 percent the line sits flat against the ceiling. The money survived essentially everything history could throw at it. Just past 4 percent the line rolls over and drops, and by 5 percent almost one period in five ended in an empty account. This is why 4 percent gets singled out. It sits right at the last point where the historical survival rate is still pinned near 100 percent, on the edge of a cliff. Push a little past it and the safety margin evaporates fast.
That flat-then-falling shape is the real content of the rule. The 4 percent number is not magic. It is the operating point where a specific system, a US 60/40 portfolio drawn down over 30 years, stayed inside its safe region across the input history it was tested on.
A bad first decade is what sinks a retirement
Notice that even at 4 percent there was one failure, and at 4.5 percent there were seven. What matters is which ones failed, because the failures are not scattered randomly across history. They cluster.
Every near miss and the single outright 4 percent failure in my results share a start date in the late 1960s. The 4 percent portfolio that ran out of money started in 1966. The thinnest survivors, the retirements that limped to the 30-year line with almost nothing left, started in 1965, 1969, and 1968. The 1965 starter ended with about 27 percent of the real starting portfolio, a rounding error away from ruin. Nobody who retired in 1975 or 1982 had trouble. The danger was concentrated in a narrow band of unlucky start years.
What did those years have in common? They put a weak, inflation-ravaged decade at the very front of the retirement. A retiree starting in the mid to late 1960s walked straight into the 1966 to 1982 stretch of flat nominal stock prices and then the double-digit inflation of the 1970s. Stocks went roughly nowhere in real terms for years while the cost of living, and therefore the required withdrawal, climbed relentlessly.
This is sequence-of-returns risk, and it is the true enemy of a withdrawal plan. The order of your returns does not matter to a portfolio you never touch, because multiplication commutes and shuffling the years cannot change the final product. The instant you pull a fixed amount out every year, order becomes decisive. A control engineer would say the withdrawal turns an open-loop system into a closed-loop one. Each year’s withdrawal is a fixed dollar drain, but its weight relative to the portfolio depends on how large the portfolio already is, and that depends on every return that came before. A bad first decade forces you to sell shares to fund spending while prices are down, so you liquidate a larger fraction of the portfolio to raise the same real income. Those shares are gone. They are not there to compound when the market finally recovers, so the eventual rebound arrives at a permanently smaller base. Two retirees can face the identical set of 30 annual returns and end in completely different places purely because one met the bad years first. The average return over the full period can be perfectly healthy and the early-retiree still runs dry.
That is why the rule is really a statement about the worst starting point, not the typical one. The 4 percent number was reverse-engineered from the unlucky retiree. For anyone who started in an average year, 4 percent was far too cautious and left a large balance untouched.
The rule was built for 30 years, not 45
The 30-year horizon is the condition people drop most often, and it is the one that quietly does the most damage.
Bengen studied a 30-year retirement because that was a reasonable planning horizon for someone retiring at 65. Someone retiring at 50, or a couple where one partner lives to 95, is planning for 40 or 45 years, and a longer horizon changes the arithmetic in two compounding ways. The money has to last half again as long, and a bad early sequence has more remaining years to inflict damage before any recovery can help. Both effects push the safe rate down.
The same backtest makes this concrete. When I extend the horizon to 40 years, using the 59 rolling periods from 1928 through 1986 that have a full 40 years of data, the survival numbers slip. At 4 percent, survival falls from 98.6 percent over 30 years to 93.2 percent over 40 years. At 4.5 percent it drops to 81.4 percent, and at 5 percent it falls to 61 percent. Meanwhile 3.5 percent still survived all 59 of the 40-year periods, and 3.0 percent survived all of them too. The lesson is direct. Stretch the retirement to 40-plus years and the historically safe rate drifts down from 4 percent toward the 3 to 3.5 percent range. The 4 percent rule does not fail loudly for a long retirement. It just quietly stops being the safe rate and becomes a moderately risky one.
The other two conditions matter just as much even though I did not test them here. The record above is entirely US data over the single luckiest run of stock and bond returns any country produced in the twentieth century. Studies that repeat the exercise across other developed markets generally find lower safe rates, because most countries did not deliver the American combination of strong equity returns and long disinflation. And the whole thing assumes rigid spending. A real retiree who never adjusts a dollar of spending after a 40 percent crash is behaving in a way almost nobody actually would.
Treat it as a planning anchor
The honest way to use the 4 percent rule is as a first estimate you then adjust, the way an engineer uses a nominal operating point and then designs feedback around it.
Two adjustments do most of the work. The first is variable spending. The rule assumes you set the dial once and never move it, which is exactly the rigidity that sinks the worst-case retiree. If instead you trim spending modestly after a bad year and allow yourself a raise after a good one, you add the feedback the fixed rule lacks. Guardrail strategies, which cut spending when the withdrawal rate drifts too high and permit increases when the portfolio grows, let a retiree start above 4 percent because the plan corrects itself before the account is in danger. The second is a valuation-aware starting rate. The worst historical outcomes began at moments when stocks were expensive relative to earnings, because a high starting valuation is a headwind for the crucial first decade. When markets are richly priced, starting nearer 3.5 percent buys back much of the safety margin. When they are cheap, 4 percent or a bit more has ample historical support.
None of this makes the 4 percent rule wrong. It makes it what it always was, a well-chosen anchor derived from one country’s 30-year history, sitting right at the edge of the safe region. Use it to get in the neighborhood of how much you can spend. Then respect the conditions it came with. A longer retirement, a portfolio outside the US, or a promise of certainty each pull you off that edge in the wrong direction, and the calm flat part of the curve is narrower than the headline number suggests.