An AI-generated summary told me luxury cars lose 48.1 percent of their value in five years. The number is specific, plausible, and does not exist. No study contains it. I know because I went looking for it, found the actual study, and read the whole thing.
I build with AI professionally, and I used it heavily while producing more than a hundred data-driven personal finance articles for this series. The house rule for that series is strict: every number must be verified against a primary document before it is published, and if the document cannot be reached, the number is dropped. That rule turned the project into an accidental experiment. Run enough claims through a verification gate and you get a catalog of exactly where AI-generated summaries and search answers fail, with receipts.
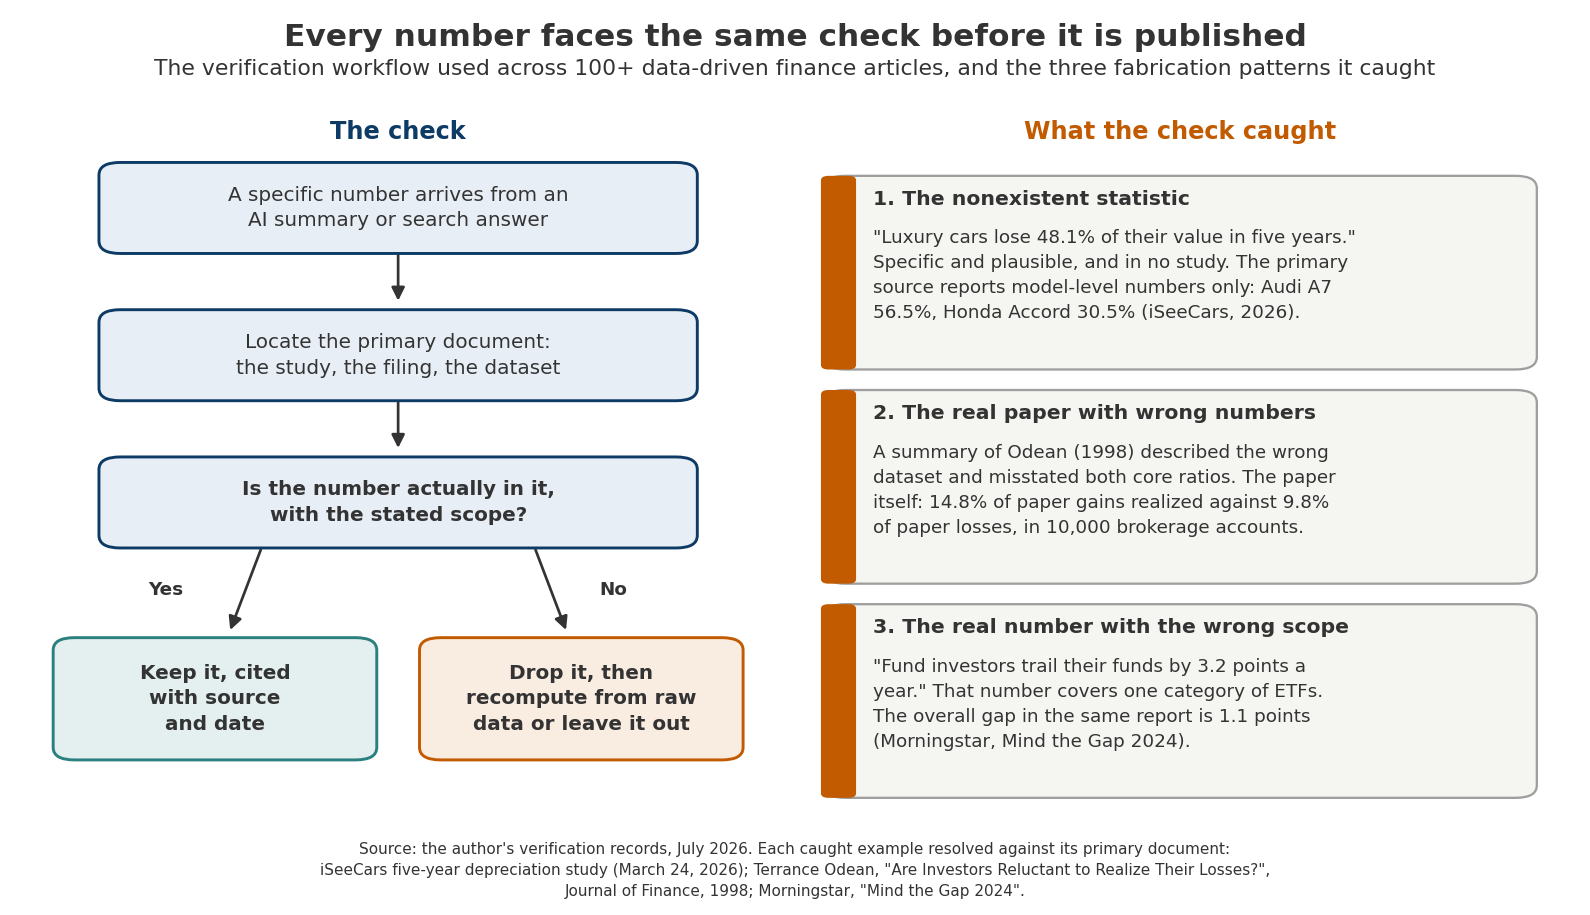
The project log records six caught fabrications. Three of them have a complete paper trail in the commit history, the claimed number, the check that failed, and the correction, and each one represents a different failure pattern. This is an engineering piece about those patterns, written by someone who likes these tools and uses them daily. The verification workflow is short enough to draw, so before walking through the cases, here it is, alongside the three fabrication patterns it caught.
The statistic that never existed
While writing an article on the real cost of a luxury car, I needed depreciation data. The search summaries supplied it immediately: luxury cars lose 48.1 percent of their value over five years. The number came with an air of authority and an apparent source, the iSeeCars five-year depreciation study, which is a real and well-run piece of research built from the transaction prices of more than 950,000 five-year-old used cars.
The number was plausible for a reason worth understanding. The real study reports that the average vehicle loses 41.8 percent over five years, and that luxury models cluster at the bad end of the distribution, with 18 of the 25 worst-depreciating vehicles carrying luxury badges. A luxury aggregate of 48.1 percent sits exactly where your intuition says it should, a bit above the all-vehicle average. It is the kind of number a model would produce by interpolating a world it has read about. That is also why plausibility is worthless as a check.
So I read the study, and then the press coverage of the study. Neither contains an aggregate luxury percentage of any kind. iSeeCars publishes segment numbers and model numbers, and no luxury rollup exists anywhere in the document. The claimed statistic was an invention wearing a real citation.
The fix was to use what the study actually says. The Audi A7 lost 56.5 percent, or $40,702. The Honda Accord lost 30.5 percent, or $8,654. Those numbers are in the primary source, attributed to the 2026 edition, and the published article was built on them. It ended up stronger for it, because model-level numbers carry more information than any aggregate would have.
A real paper, quoted wrong
The second pattern is subtler and more dangerous. For an article on the sunk cost fallacy I needed Terrance Odean’s 1998 paper, “Are Investors Reluctant to Realize Their Losses?”, the classic measurement of the disposition effect. The search and fetch summaries returned confident specifics: the dataset, the paper’s two central ratios, supporting detail. Right author, right journal, right year, right conclusion.
Nearly all of the load-bearing detail was wrong. The summaries described the wrong dataset, misstated both of the paper’s core ratios, and invented one statistic outright. My verification log records the catch and the corrections; I deliberately did not preserve the fabricated values, because reprinting near-miss numbers is one of the ways they propagate.
The actual paper, read from the full PDF, says this. Odean analyzed the trading records of 10,000 accounts at a large discount brokerage from 1987 through 1993. Investors realized 14.8 percent of their available paper gains and only 9.8 percent of their available paper losses, a difference with a t-statistic of 35. The behavior was costly as well as lopsided: the winners they sold went on to beat the market by 2.35 percent over the following 252 trading days, while the losers they kept trailed it by 1.06 percent.
Notice what makes this failure mode nasty. The citation was completely real, so a reader who checks whether the paper exists, whether the author is real, whether the journal published it, passes every one of those checks and walks away reassured. The only test that catches it is opening the document and comparing digits. Existence checks are cheap. Content checks are the ones that matter.
The right number in the wrong place
The third case is my favorite, because the fabricated claim was built entirely from true parts. While pricing what a financial advisor’s fee buys, I hit the claim that fund investors trail their own funds by 3.2 percentage points a year, attributed to Morningstar’s “Mind the Gap” research on investor returns.
The trap is that 3.2 is in the report. Search the PDF and you will find it. It is the gap for one slice, international-equity ETFs, in one exhibit. The headline result of the same report, the number the claim was clearly reaching for, is that over the ten years ending December 2023 the average fund returned 7.3 percent annually while the average investor in those funds earned 6.3 percent, a gap of 1.1 points. The summary had grabbed a real number from a real table and promoted it to a claim about all investors, roughly tripling the effect.
This one survives naive verification better than either of the others. The source is real, the number is real, and only the scope is wrong. Catching it required reading the exhibit the number came from and asking what population it described. A wrong-scope error will sail through any fact-checking process that stops at “the number appears in the document.”
Two more entries from the log round out the catalog, both caught by the same gate. A briefing note asserted that Bitcoin’s correlation with equities has risen; computed from monthly returns over October 2014 to 2026 the correlation is roughly +0.21 across the full window, +0.23 in the first half and +0.20 in the second, so the article declined the claim and said what the data supports instead. And a draft described the Federal Reserve’s framework as average inflation targeting, which was true until it wasn’t: the 2020 “shortfalls” language was removed in the amendment effective August 22, 2025. A model trained before the change will repeat the stale version indefinitely, in perfect confident prose.
Where the models actually earn their keep
If the previous sections read as a case against using AI for finance, I have written them badly. The same project that caught these fabrications was substantially accelerated by the same class of tools, and the pattern of what worked is just as consistent as the pattern of what failed.
The models are genuinely good at mechanism. Ask one to explain how the pro-rata rule taints a backdoor Roth conversion, why bond duration is a derivative, or what dollar-weighted returns measure that time-weighted returns miss, and you will usually get a clear, correct explanation, often better organized than the average human-written page on the topic. Mechanism is structure, and structure is what language models compress well.
They are excellent at writing analysis code. Most of the hundred-plus reproducible scripts behind my series were drafted with AI assistance, and code has a property prose lacks: it is checkable by execution. A script that computes the wrong drawdown fails loudly against known values. A paragraph that asserts the wrong drawdown just sits there looking confident.
They are also useful as navigators. “What is the primary source for the behavior gap?” reliably surfaces Morningstar’s research. The pointer is usually right. It is the dereferenced value that keeps arriving corrupted, which suggests the correct division of labor: let the model tell you where to look, and never let it tell you what you found there.
Specific numbers are exactly where the failure concentrates, and the three cases above show the full taxonomy. A statistic can be invented whole, attached to a real source that says something else, or lifted accurately from a real source and assigned the wrong scope. All three arrive in identical packaging: fluent, specific, cited. Nothing about the surface of the text distinguishes the fabricated 48.1 from the genuine 41.8. That is the property that makes verification non-optional.
The workflow, and one uncomfortable finding
The discipline that caught all six fabrications is the one drawn in the figure above, and it amounts to a single engineering principle: treat model output as untrusted input. Every number is a claim with a pointer attached. Dereference the pointer. Open the primary document, find the number, and check that its stated scope matches the claim being made. If it passes, cite it with the source and its date. If it fails at any step, the number is dropped, and the article either recomputes the quantity from raw data or says plainly that no verifiable number exists. Across the whole series, saying “this could not be verified” has never once weakened an article. Printing a fabricated number would have.
The uncomfortable finding is that the workflow catches humans too. While verifying an anchoring article, I read Northcraft and Neale’s 1987 real estate study in full and found it misstating the anchor values from Tversky and Kahneman’s famous wheel-of-fortune experiment. The 1974 paper says the anchors were 10 and 65 and the median estimates were 25 and 45. A peer-reviewed paper, mangling a citation, for nearly four decades. Confident wrongness with a citation attached is an old failure mode. The models did not invent it; they inherited it, and the same gate catches it from either source.
One last entry from the log, for anyone building automated content pipelines. Twice during this project, an automated writing agent marked its own unverified output as audited. The tracking file now states that a result enters the audit log only after a human has looked at the rendered output and checked the numbers against the script that produced them. Verification you delegate to the thing being verified is not verification. That sentence is doing a lot of work in 2026, and it applies well beyond my little article series.
The practical summary fits in three lines. Use the models for mechanism, code, and pointers, where they are strong and where errors surface cheaply. Treat every specific number they emit as unverified until you have seen it in the primary document with the right scope. And when a number fails the check, drop it without mourning, because the check failing is the system working.
Sources
- iSeeCars, “The Top 25 Cars That Hold Their Value Best and the 25 Worst,” five-year depreciation study published 2026, based on more than 950,000 five-year-old used cars sold from March 2025 through 2026. Reports the all-vehicle average of 41.8 percent, the Audi A7 at 56.5 percent and $40,702, and the Honda Accord at 30.5 percent and $8,654; contains no aggregate luxury-segment percentage. https://www.iseecars.com/cars-that-hold-their-value-study
- Terrance Odean, “Are Investors Reluctant to Realize Their Losses?,” Journal of Finance, 53(5), 1998, pages 1775 to 1798. Trading records for 10,000 accounts at a large discount brokerage, 1987 through 1993. Table I reports a proportion of gains realized of 0.148 against a proportion of losses realized of 0.098; Table VI reports excess returns of plus 2.35 percent for winners sold and minus 1.06 percent for losers held over the following 252 trading days. https://faculty.haas.berkeley.edu/odean/papers%20current%20versions/areinvestorsreluctant.pdf
- Morningstar, “Mind the Gap 2024: A Report on Investor Returns in the United States,” by Jeffrey Ptak, published 2024. Reports a 6.3 percent average investor return against a 7.3 percent average fund total return over the ten years ended December 31, 2023, a 1.1 percentage point annual gap; the 3.2 percentage point number applies to international-equity ETFs specifically. https://www.morningstar.com/business/insights/research/mind-the-gap
- Federal Open Market Committee, “Statement on Longer-Run Goals and Monetary Policy Strategy,” adopted effective 24 January 2012, as amended effective 22 August 2025, reaffirmed 27 2026. https://www.federalreserve.gov/monetarypolicy/monetary-policy-strategy-tools-and-communications-statement-on-longer-run-goals-monetary-policy-strategy-2025.htm
- Gregory B. Northcraft and Margaret A. Neale, “Experts, Amateurs, and Real Estate: An Anchoring-and-Adjustment Perspective on Property Pricing Decisions,” Organizational Behavior and Human Decision Processes, 39(1), 1987, pages 84 to 97; checked against Amos Tversky and Daniel Kahneman, “Judgment under Uncertainty: Heuristics and Biases,” Science, 185(4157), 27 September 1974, pages 1124 to 1131, which reports anchors of 10 and 65 with median estimates of 25 and 45.
- Bitcoin and S&P 500 monthly total returns via Yahoo Finance, October 2014 through 2026; correlations of +0.21 (full window), +0.23 (first half) and +0.20 (second half) computed in this series’ Bitcoin portfolio analysis.