Emerging economies grew several times faster than the rich world for two decades. The people who bought their stocks did not collect several times the returns, or even higher ones.
That sentence should feel wrong. The whole case for owning emerging markets rests on a chain of reasoning that sounds airtight. Poorer countries have more room to grow, so their economies expand faster. Faster economic growth means faster corporate growth. Faster corporate growth, plus the extra risk of investing in less stable places, should show up as higher stock returns. Every link looks solid. The chain still fails to hold weight, and the failure is worth understanding, because the same broken link shows up in plenty of other places once you know its shape.
I build systems for a living, and this is a failure mode I recognize. It is the gap between a metric that is easy to measure and the outcome you actually care about. Optimizing throughput on one service does not guarantee the end-to-end request gets faster if the bottleneck is somewhere else. Economic growth is the throughput number for a country. Shareholder return is the end-to-end latency you experience. They are connected, but the connection leaks at every stage, and in emerging markets it leaks so much that the two numbers come apart entirely. Here is what that divergence looks like across two decades of actual prices, emerging markets against the US.
The economies delivered exactly what the theory ordered
Start with the part that worked. Emerging economies did grow far faster than developed ones, and it was not close.
International Monetary Fund World Economic Outlook data show that emerging market and developing economies expanded real GDP by roughly 5 percent a year across the 2000 to 2019 stretch, while advanced economies grew closer to 1.8 percent a year over the same period. China alone compounded real GDP near 9 percent annually for most of the 2000s and 2010s, according to World Bank national accounts data. Over two decades a 5 percent economy more than doubles in real size while a 1.8 percent economy grows by roughly 40 percent. On the single variable the theory says should drive stock returns, emerging markets did not merely win. They lapped the field.
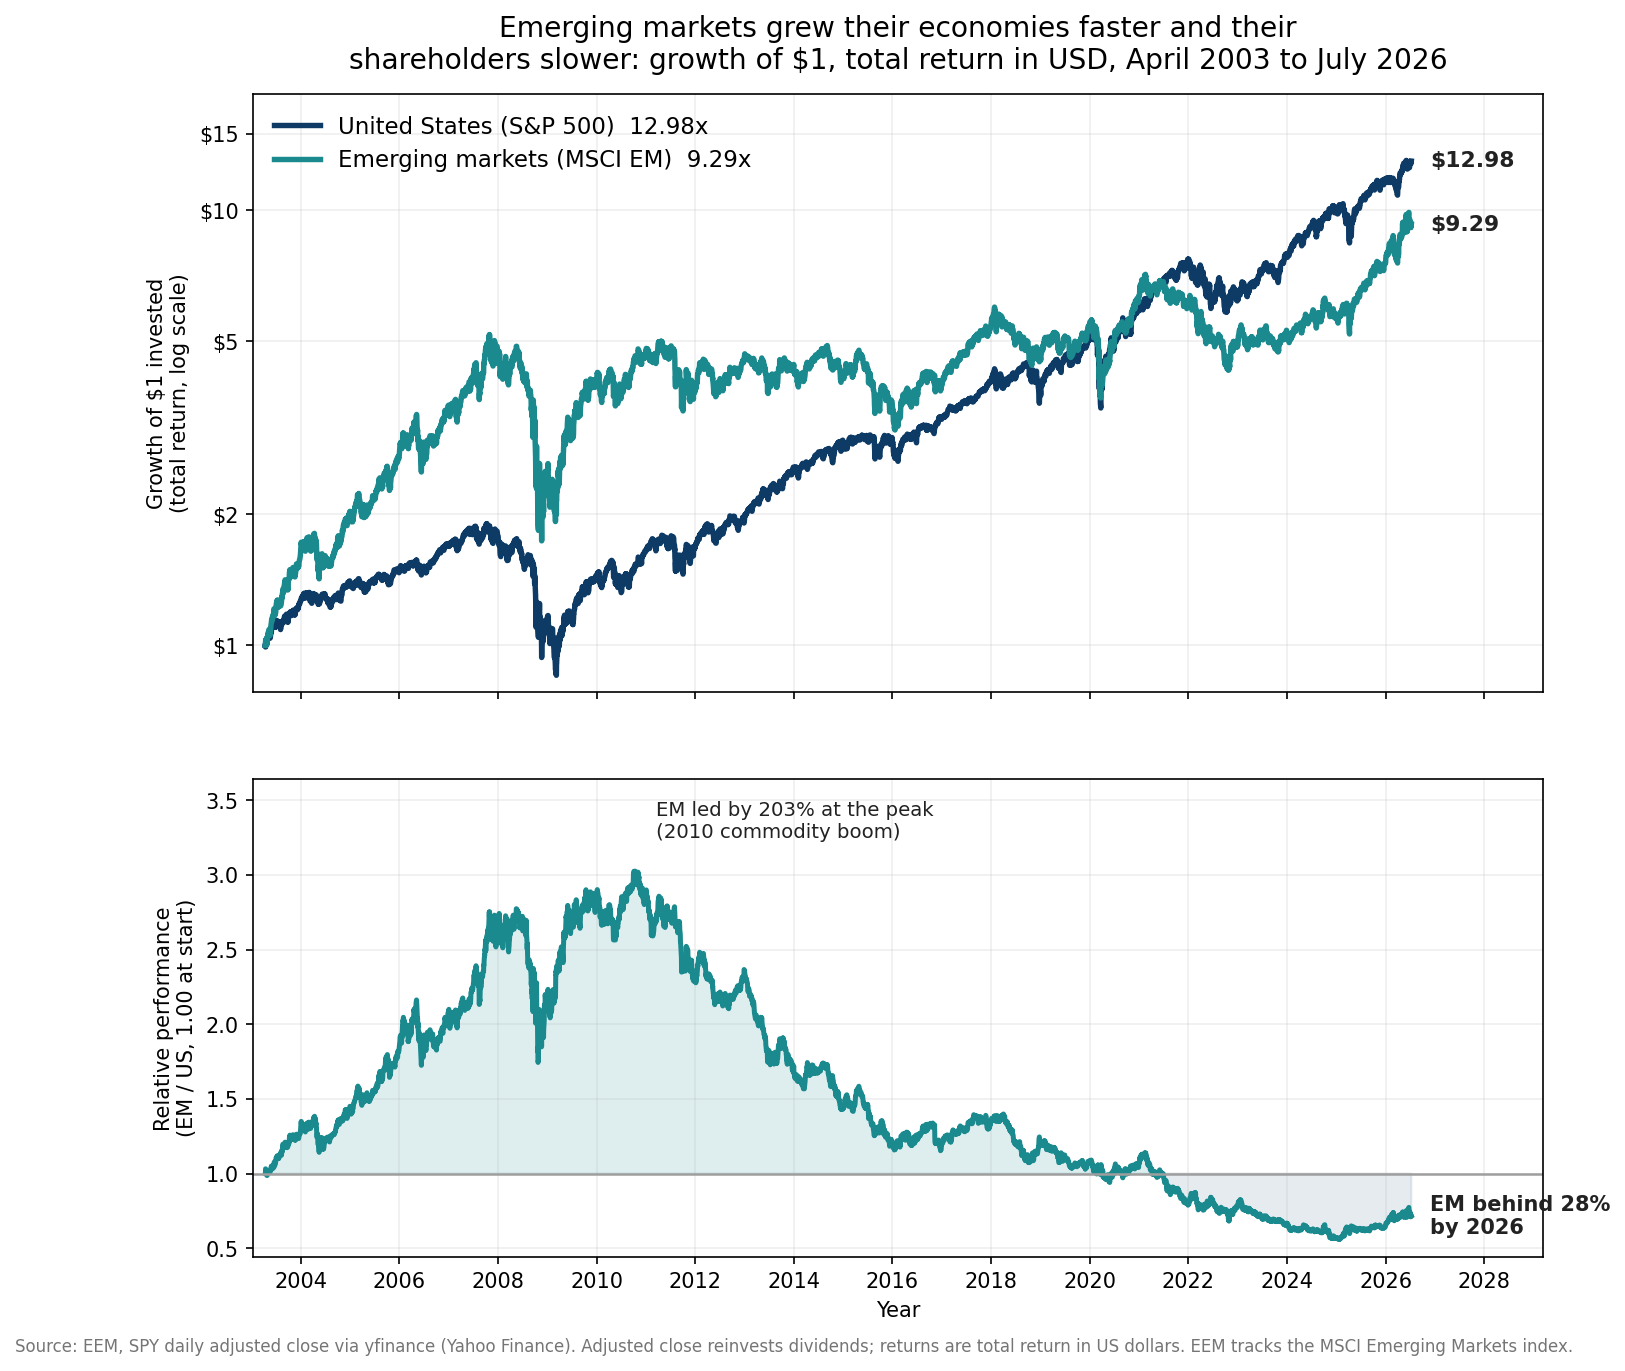
Now put that against what the shareholders received. The chart above tracks the growth of one dollar invested at total return, dividends reinvested, in emerging markets versus the United States, computed from ETF prices through 2026. The emerging-market leg is the iShares MSCI Emerging Markets ETF (ticker EEM, which tracks the MSCI Emerging Markets index and holds stocks across China, India, Taiwan, Korea, Brazil, and dozens of other developing markets). The US leg is the SPDR S&P 500 ETF (ticker SPY). The window runs from EEM’s inception in April 2003, roughly 23 years, plotted on a log scale so the early and late years read together.
Over that window a dollar in the S&P 500 grew to 12.98 dollars, a compound annual growth rate of 11.66 percent. The same dollar in emerging markets grew to 9.29 dollars, a growth rate of 10.07 percent. The US finished ahead by a factor of 1.40. Twenty-three years of dramatically faster economic growth in the emerging world produced a stock return that trailed the US by more than a percentage point and a half a year.
The lead the economies bought lasted five years, then reversed for fifteen
The full-window number actually flatters emerging markets, and the bottom panel of the figure shows why. It plots the relative line, emerging markets divided by the US, rebased to 1.00 at the start. Above 1.00 means emerging markets are ahead. Below means the US is.
The line rockets upward through the mid-2000s. EEM launched in April 2003, right at the bottom of a global bear market and just as a commodity supercycle was about to lift the resource-heavy emerging index. By October 2010 emerging markets had beaten the US by 203 percent since the start of the window. If you had checked at that peak, the theory looked triumphant. Fast-growing economies were delivering fast-growing returns, exactly as promised, and being early in emerging markets felt like the obvious trade.
Everything after 2010 is the correction. The relative line falls, with a few bounces, for the next fifteen years, and by 2026 emerging markets sit 28 percent behind the US since the 2003 start. An investor who bought at that 2010 peak of enthusiasm, when the story was loudest, has spent a decade and a half watching the US pull away. The Vanguard FTSE Emerging Markets ETF (ticker VWO), which I fetched as a cross-check and whose data begins in March 2005, compounded at just 6.94 percent a year through 2026, while the Vanguard Total Stock Market ETF (ticker VTI) compounded at 11.87 percent over the matching stretch. The typical investor, the one who arrived after the early boom instead of before it, lived the wide gap, not the narrow one.
So the record is not that emerging markets never win. They won big early. The record is that the faster-growing economies delivered a burst tied to a commodity cycle and a cheap starting price, and then fifteen years in which the growth kept coming and the returns did not follow. This is not a data artifact of one fund. It shows up in EEM and VWO alike, against SPY and VTI alike.
Fast growth is real, but very little of it reaches your shares
Here is where the leak actually happens. Faster GDP growth is genuine, and it does create enormous value. The question is who captures that value, and the answer, for existing shareholders, is often almost none of it.
Jay Ritter of the University of Florida documented this directly in a 2005 study in the Pacific-Basin Finance Journal, later updated, that measured the relationship across 16 countries from 1900 onward. He found the correlation between a country’s real per-capita GDP growth and its real stock returns was negative, around minus 0.4. Countries that grew faster tended to reward stock investors slightly less, not more. Elroy Dimson, Paul Marsh, and Mike Staunton reached the same conclusion in the Credit Suisse Global Investment Returns Yearbook, finding no positive link between long-run economic growth and equity returns across the century of data they assembled.
The mechanism has three parts. First, a lot of a fast-growing economy accrues to workers as rising wages, to consumers as cheaper goods, and to the government as taxes, none of which flows to shareholders. Second, much of the growth is captured by companies that do not exist yet. The Chinese e-commerce giant, the Indian software firm, the Brazilian fintech, when they finally list, they hand their gains to their founders and early venture backers, not to the person who bought the emerging-market index a decade earlier. The index investor gets to buy those winners only after they are already large and priced.
Third, and most corrosive, is dilution. Fast-growing companies fund their growth by issuing new shares, and every new share cuts the claim each existing share has on future profits. Robert Arnott and William Bernstein showed years ago in the Financial Analysts Journal that net new share issuance quietly subtracts from the returns index investors actually earn, and the effect is far larger in emerging markets than in the developed world. Research Affiliates has estimated that net share issuance in emerging markets has diluted existing shareholders by roughly 2 to 3 percentage points a year over long spans. A market can grow its total corporate earnings quickly while the earnings attached to each of your shares grow slowly, because the pie is being cut into ever more slices. That is the growth trap in one sentence.
Two more leaks sit on top of dilution, and both are structural instead of cyclical.
The first is governance and the protection of minority shareholders. When you own a share, you own a legal claim on a slice of the profits, and that claim is only worth what the legal and corporate system will enforce. The body of research on law and finance, led by Rafael La Porta, Andrei Shleifer, and their coauthors, established decades ago that countries with weaker legal protection for outside investors see profits diverted to controlling shareholders, the state, or insiders before minority holders ever see them. Many large emerging-market indices are heavy with state-controlled enterprises run partly for national goals, and with family conglomerates where the controlling family’s interests do not always match yours. The profit can be real and still not arrive in your account.
The second is currency. Your return as a US investor is measured in dollars, and it blends how the companies did in their home currencies with what happened to the exchange rate. Emerging-market currencies have tended to weaken against the dollar over long horizons, pressured by higher inflation and periodic crises, from the Asian financial crisis in 1997 to the Russian default in 1998 to more recent strains in the Turkish lira and Argentine peso. When the local currency falls, the local-currency gains convert back into fewer dollars. MSCI has published its Emerging Markets index since 1988, and its long history carries exactly this signature, real economic development paired with deep drawdowns and a currency drag that erodes the dollar-based return. Over its full published life the index has delivered returns broadly in line with developed markets while subjecting investors to much larger swings, which is the opposite of the extra reward the risk was supposed to earn.
The one edge you can measure today is price
None of this means emerging markets are uninvestable. It means the reason to own them is not the one on the brochure. The honest case is narrower and sturdier, and it rests on the single variable you can actually observe right now, which is how cheaply they are priced.
The standard gauge is the cyclically adjusted price-to-earnings ratio, or CAPE, which divides price by the average of the last ten years of inflation-adjusted earnings so one boom or bust year does not distort it. Robert Shiller’s data, the canonical source for the US series, put the American CAPE in the mid-to-high 30s across 2024 and into 2025, a level reached only around 1929 and around 2000 in more than a century of records. Research Affiliates and Barclays, which both publish CAPE broken out by region, have shown emerging markets trading in the low-to-mid teens across the same period, close to a third of the US level. Read that as a snapshot dated to 2024 and 2025 and check the current regional numbers before you act on it, because valuations move.
A price gap of that size is not a timer. Cheap markets can stay cheap for years, and emerging markets have been the cheaper market for most of the stretch they also trailed. What a lower starting valuation buys you is a better starting point, and lower starting valuations have historically been associated with higher long-run returns across markets. It is a reason for exposure, not a prediction of the turn.
A modest slice, held as insurance and not as a growth bet
Put the pieces together and the allocation almost writes itself. Emerging markets do not belong in a portfolio because their economies grow fast. The last two decades are a clean demonstration that fast economic growth and strong shareholder returns are different variables that can diverge for a very long time, and the dilution, governance, and currency leaks explain why the divergence is structural instead of bad luck.
They belong in a portfolio for a duller reason. They are large, they move on partly different drivers than the US market, they are priced far below it today, and holding a modest slice of them means your entire outcome is not hostage to US stocks continuing to dominate. That is diversification, the same logic that keeps a careful engineer maintaining a backup path that has sat idle for years. You hold it not because you expect to need it next quarter but because you cannot predict the quarter you will, and by the time you can, adding it is too late.
Size it accordingly. A slice in the range that broad global market weights imply, held and rebalanced without a story about the emerging century arriving, treats emerging markets as what the evidence says they are. They are a diversifier with a valuation tailwind, not a growth engine that pays you for the growth. The theory promised the growth would become your return. Thirty years of data, and the fifteen-year slide in the figure, say the growth is real and the return is a separate question you have to answer with price, not with GDP.