You inherit 60,000 dollars. Put it in the market today, or feed it in over a year? I tested both across 1,853 monthly windows of S&P 500 history, and putting it all in at once won 72 percent of the time.
That question has a clean engineering shape. You are holding a fixed amount of capital, and you get to choose a deployment schedule. One schedule spends the whole budget at time zero. The other spreads it evenly across twelve steps. The output you care about is the account value once the money is fully deployed. So the fair way to settle the argument is to run both schedules over real history and compare the outputs at the same finish line.
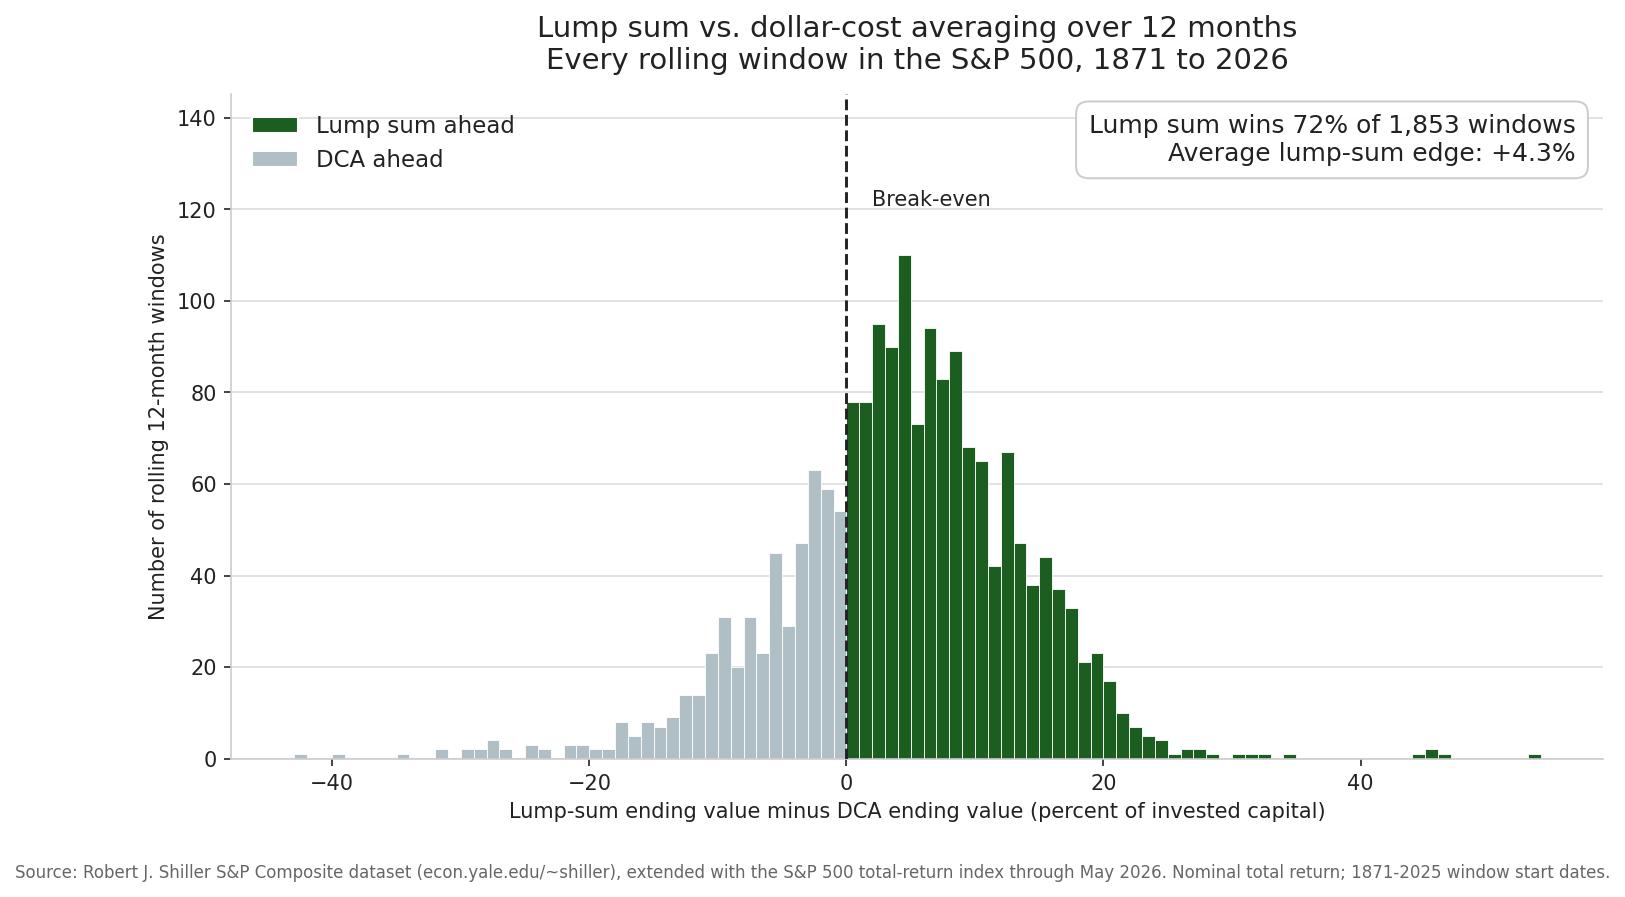
I did exactly that, using Robert J. Shiller’s monthly S&P Composite dataset (econ.yale.edu/~shiller), with dividends reinvested each month. The histogram below shows how every one of those 1,853 windows turned out, as the gap between the lump-sum finish and the DCA finish.
The two deployment schedules
Lump sum means you invest the entire windfall at month zero and hold it. In control terms, it is a step input. The full signal arrives immediately, and from that moment your whole balance is exposed to whatever the market does.
Dollar-cost averaging (DCA) means you split the windfall into twelve equal pieces and invest one piece per month for a year. It is a ramp input. Your exposure climbs from one twelfth in the first month to the full amount only in the twelfth month. For most of the deployment year, part of your money sits in cash, waiting its turn.
People reach for DCA because it feels safer. Spreading purchases across many prices means you never bet everything on a single day. That intuition is real, and I will quantify it below. What the intuition hides is the cost of waiting, and over a rising market the cost of waiting is not small.
To compare the two fairly, I hold both to the same date. For every start month in the history where a full twelve-month window exists, I compute two ending values. Lump sum is worth the total-return index at month twelve divided by the index at month zero, so one dollar grows by the market’s twelve-month return. DCA is worth the average of twelve tranche outcomes, where each monthly dollar grows from its own purchase month to month twelve. Both start from one dollar of capital. Both are valued on the same day. The only difference is timing.
That setup produces 1,853 overlapping windows, from a start month of January 1871 through May 2025. Every window is a real, historical year of prices, including the crashes.
Lump sum wins in 72 percent of windows
Across all 1,853 windows, lump sum ended ahead of DCA in 1,333 of them. That is 71.9 percent, so lump sum won just over seven times out of ten. DCA won the other 520 windows, about 28 percent. There were no exact ties.
The size of the edge matters as much as the frequency. Averaged over every window, lump sum finished 4.3 percent of invested capital ahead of DCA. On a 60,000 dollar windfall, that average gap is roughly 2,600 dollars, earned for doing nothing more complicated than not waiting. The median window told the same story, with a lump-sum edge of 4.6 percent.
That distribution is what the histogram above is plotting: the lump-sum ending value minus the DCA ending value, measured in percent of invested capital, across all 1,853 windows. The dashed line sits at zero. Everything to the right, drawn in green, is a window where lump sum won. Everything to the left, in grey, is a window where DCA won. The mass of the distribution sits clearly to the right of zero, and the right tail runs further out than the left. Lump sum does not just win more often. When it wins, it tends to win by more.
The reason is not subtle. Stocks spend more time going up than going down. If the market is more likely to be higher next month than lower, then money invested this month is more likely to be worth more than money you are still holding in cash. DCA voluntarily parks part of your capital on the sidelines during the exact period when, on average, being invested pays. You are not reducing risk for free. You are trading expected return for a smoother ride, and the market charges you for the trade.
Vanguard found the same thing across three countries
I am not the first to run this. Vanguard published a study titled “Dollar-cost averaging just means taking risk later,” and it reached the same conclusion on a broader canvas. Looking across the United States, the United Kingdom, and Australia, Vanguard found that investing a lump sum beat averaging in about 68 percent of the twelve-month periods they examined. Their headline number, 68 percent, and mine, 72 percent, land close together despite using different data spans and markets.
That agreement matters. When an independent study on different countries and a from-scratch backtest on 150 years of US data both point to roughly seven in ten, the finding is not an artifact of one dataset or one clever choice of window. It is a property of how markets move. Rising more often than they fall is the default behavior of a broad stock index over long horizons, and any strategy that delays exposure pays for that delay.
The mechanism Vanguard names is the honest one. DCA does not remove risk. It postpones it. The dollars you have not invested yet are safe only in the sense that they are not participating. The day the last tranche goes in, your full balance is exposed, exactly as it would have been on day one with lump sum. You did not avoid the risk. You showed up to it late, and you gave up the returns that accrued while you waited.
When averaging wins, and why it still has a place
None of this makes DCA foolish. It makes DCA a form of insurance, and insurance has a premium and a payout. The 4.3 percent average edge for lump sum is the premium. The payout comes in the windows where the market fell right after you would have gone all in.
Those windows are easy to name, because they are the famous ones. The worst window for lump sum in the entire history began in August 1931, deep in the Great Depression, where going all in trailed DCA by 43 percent. The 1937 downturn produced several of DCA’s largest wins. The 2008 financial crisis shows up plainly. An investor who put a full lump sum to work in August 2008 ended the next twelve months about 27 percent behind an investor who averaged in, because spreading purchases across the crash bought many shares at panic prices. Buy right before a peak, and DCA rescues you.
The pattern of when DCA wins is itself informative. I grouped DCA’s 520 winning windows by the decade in which they started. The 1930s produced 60 of them and the 2000s produced 48, the two most crash-heavy stretches in the sample. The 1990s, a long and steady bull market, produced just 6. DCA earns its keep in exactly the environments where lump sum hurts, and it sits idle and slightly behind through the long calm stretches that make up most of history. That is the shape of an insurance policy. You pay small premiums for years, and the policy pays off in the disaster.
Consider the peaks the thesis warns about. An investor deploying a lump sum in September 1929, one month before the crash, finished the year 24 percent behind the averaging investor. Around the dot-com top, the windows starting in August and September 2000 each left lump sum about 12 percent behind. In every one of these cases, the averaging investor was buying more shares as prices collapsed. That steady buying softened the blow. The catch is that you only know you bought at a peak afterward. Peaks are obvious in hindsight and invisible in the moment.
There is also a behavioral case for DCA that the math does not capture, and it is not a weak one. The right strategy on a spreadsheet is worthless if you cannot hold it. An investor who goes all in and then watches the market drop 20 percent may panic and sell at the bottom, locking in a loss and abandoning the plan. That single reaction can cost far more than the 4.3 percent expected edge lump sum offers. DCA lowers the odds of that reaction. By keeping some money in reserve and turning a scary drop into a buying opportunity, it makes the plan easier to stick with. A slightly worse strategy that you actually follow beats a slightly better one that you bail on.
So the honest framing is a trade, and you get to price it. If you can invest a windfall today and stay invested through whatever comes next, the history says do it, because roughly seven times out of ten and by about 4 percent on average, being in beats waiting to be in. If you know that a sharp early drop would rattle you into selling, then paying the small expected premium to average in over a year is buying yourself the discipline to stay in the game. Both are defensible. What is not defensible is believing that spreading your purchases removes risk. It moves the risk down the road and hands back some return for the privilege.
The market rises more often than it falls. That single fact is why deploying capital sooner has usually won, and why the strongest argument for averaging is about your own behavior under stress, not about beating the market.
Sources
- Robert J. Shiller, “Irrational Exuberance” monthly S&P Composite dataset, http://www.econ.yale.edu/~shiller/data.htm. The Shiller deep history, where total return is reconstructed by reinvesting one twelfth of the annualized dividend each month at that month’s price, is extended with the official S&P 500 total-return index (dividends reinvested) to the latest month so the series stays current. Backtest over 1,853 rolling twelve-month windows, start months January 1871 through May 2025.
- The Vanguard Group, “Dollar-cost averaging just means taking risk later,” study of lump-sum versus dollar-cost averaging across the United States, United Kingdom, and Australia, reporting lump sum ahead in about two thirds of twelve-month periods.