The most-cited number for raising a child in America is $233,610. It comes from a real government report, and it stopped being current a decade ago.
That figure gets quoted in headlines, baby-shower jokes, and financial planning software as though it were a price tag printed on a box. It is a genuine estimate from a genuine source, and almost every use of it drops the four qualifiers that make it meaningful. It covers a specific family type, a specific income band, a specific set of expense categories, and a specific year’s dollars. Strip those away and you are left with a scary round number that tells you very little about your own situation.
This article does three things. It states the official number precisely, with its full set of conditions. It brings that number forward to today’s dollars using published inflation data, showing the arithmetic. Then it puts the sticker price next to a cost that never appears on any receipt, which is what the same money would have compounded into somewhere else. That last comparison is an illustration of a trade-off, and it is not an argument about whether to have children. People do not have children as an investment, and the returns that matter most in this decision were never denominated in dollars.
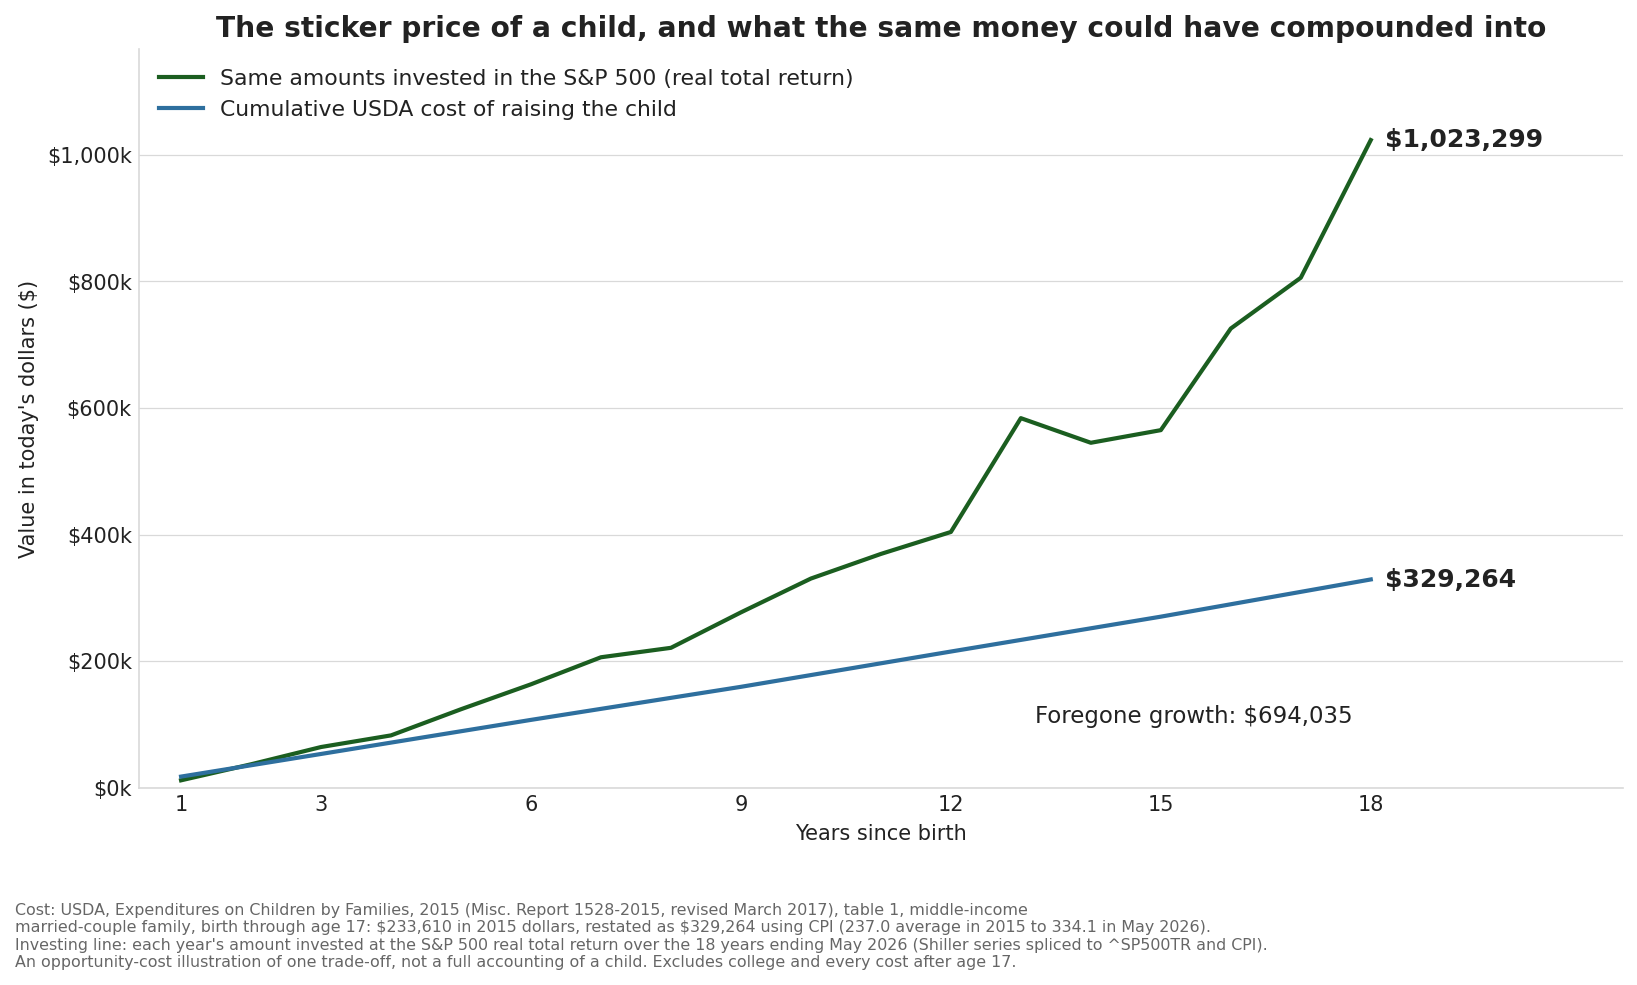
With that on the record, here are the two lines side by side: the cash a family actually spends, and what the same dollars would have become in the market.
What the Official Number Actually Measures
The source is the U.S. Department of Agriculture, which published estimates of child-rearing expenditures from 1960 onward. The most recent edition is Expenditures on Children by Families, 2015, Miscellaneous Report No. 1528-2015, by Mark Lino, Kevin Kuczynski, Nestor Rodriguez and TusaRebecca Schap, released in January 2017 and revised that March. The USDA has issued no edition since.
Here is the headline sentence from that report, with nothing removed. The estimated expense to raise a child from birth through age 17 is $233,610 in 2015 dollars, for a middle-income married-couple family with two children, where middle income means before-tax household income between $59,200 and $107,400. The estimates come from the 2011 to 2015 Consumer Expenditure Survey and cover housing, food, transportation, clothing, health care, child care and education, and a miscellaneous category. The total assumes the family had child care and education expenses on the child.
Every one of those conditions moves the number. For the lowest income group, households below $59,200, the same report gives $174,690. For the highest group, above $107,400, it gives $372,210. That is a spread of more than double between the bottom third and the top third of the income distribution, on the same task. Families spend what they have, and children absorb a share of it.
What the report excludes matters as much as what it includes. The estimates stop at age 17 and explicitly leave out college costs and every other parental expense after that birthday. They also leave out what the authors call indirect costs, meaning parental time, foregone earnings, and interrupted career trajectories. For many households the career interruption is the single largest financial consequence of having a child, and it appears nowhere in the $233,610.
The report also gives a useful long view. In 1960, expenditures on a child in a middle-income married-couple family came to $25,229, which the USDA restates as $202,020 in 2015 dollars. Over 55 years the real cost of raising a child rose 16 percent. Housing was the largest component in both eras, at 31 percent in 1960 and 29 percent in 2015. Food fell from 24 percent to 18. Child care and education went from 2 percent of the total to 16, which is the largest structural change in the entire table and the clearest signal of where the pressure now sits.
Bringing a 2015 Number Into Today’s Dollars
A figure in 2015 dollars quoted in 2026 is understated, and the fix is straightforward. The USDA itself built its estimates by updating survey data to 2015 dollars with the Consumer Price Index for All Urban Consumers, so the same index brings the total forward.
The CPI series used here splices Robert Shiller’s historical series to CPIAUCSL from FRED. The 2015 calendar-year average reads 237.0. The latest month in the dataset, 2026, reads 334.1. The ratio is 1.409, so prices are about 41 percent higher than when the report was written.
Apply that to the headline. $233,610 multiplied by 1.409 gives $329,264 in 2026 dollars. The lowest income group’s $174,690 becomes about $246,200. The highest group’s $372,210 becomes about $524,600. Expressed as an annual figure, the middle-income estimate runs from roughly $17,900 a year for a child under three to roughly $19,600 a year for a teenager between 15 and 17.
One honest caveat about that adjustment. It assumes the cost of raising a child moved with general consumer prices from 2015 to today. Child care prices have risen faster than the overall index, and the CPI-adjusted total therefore likely understates the true figure for families paying for care. I did not find a published post-2015 recalculation of the full USDA basket from any government source, so I have not invented one. The adjustment above is a floor, and it is transparent about its method.
The USDA published its own forward projection, which is worth reporting because it answers a different question. Assuming 2.2 percent average annual inflation, the report estimated total future outlays of $284,570 in then-current dollars for a child born in 2015 reaching age 17 in 2032. That number is a nominal sum of future spending. The $329,264 above is the same real burden expressed in money you recognize today. Both are correct answers to different questions, and mixing them up is the most common error in coverage of this report.
Child Care Is the Swing Factor
If one line item decides whether your experience matches the average, it is child care. The USDA put child care and education at 16 percent of the middle-income total for families who had the expense, and that share sits at zero for a family with a stay-at-home parent or nearby grandparents. The average conceals two very different lives.
Child Care Aware of America publishes an annual price survey, and its Child Care in America: 2025 Price & Supply report, released in 2026, puts the national average annual price of child care at $13,184 for 2025. That single line item is close to the entire annual USDA estimate for a middle-income child. The same report finds that price consumes about 10 percent of median income in a two-parent household and about 33 percent in a single-parent household, and that in the majority of states infant care costs more than in-state public college tuition. In every state with data, care for two children in a center exceeds median rent.
Geography multiplies the effect. The USDA found child-rearing expenses highest in the urban Northeast, followed by the urban West and urban South, with the urban Midwest and rural areas lowest. Comparing the extremes, rural expenses ran 27 percent below the urban Northeast, and the report attributes most of that gap to housing and child care. Family size cuts the other way. Married-couple households with one child spent about 27 percent more per child than two-child households, and households with three or more children spent about 24 percent less per child. Bedrooms, car seats, and outgrown coats all get reused.
The practical reading is that your number is your number. A family in rural Ohio with a parent at home and two children is running a different budget from a family in Boston paying for two center slots. The national average sits somewhere between them and describes neither.
The Cost That Never Appears on a Receipt
The figure above holds the cash cost next to something the receipts never show. Take the same inflation-adjusted annual amounts, roughly $17,900 in the early years rising to about $19,600 in the teenage years, and invest each year’s amount in the S&P 500 with dividends reinvested and inflation removed. Run it across the 18 years ending 2026, using the real total-return series described at the end.
The cumulative cash outlay reaches $329,264. The invested path reaches $1,023,299, and both figures sit in the same present-day dollars because the returns are real. The gap is $694,035, or about 3.1 times the money actually spent. Roughly two-thirds of that terminal value is growth the family never sees, since the money was consumed as it was earned.
Two caveats keep this honest. The first is that this particular 18-year window delivered a real annualized total return of about 9.0 percent, which sits well above the long-run historical average and reflects a period that began just before the 2008 crash and captured the entire recovery that followed. A different 18 years produces a different multiple, and some produce a much smaller one. The second is that the comparison assumes every dollar would otherwise have been invested, which is close to fiction for most households. Money not spent on a child goes to housing, travel, earlier retirement, and ordinary consumption in some mix that varies by family.
What the gap does capture correctly is scale. Eighteen years is a long compounding runway, and any recurring annual commitment of that size carries a shadow cost far larger than its sum. The same arithmetic applies to a car payment, a large mortgage, or a fee-heavy portfolio. Children are the case where people feel it most and calculate it least.
None of this argues against having children. The figure measures one axis of a decision that runs on several, and the other axes are not priced in dollars at all. Reading it as a verdict misses the point. Reading it as a scale marker on the cash flow you are about to commit to is exactly right.
What to Do With a Number Like This
Treat the official estimate as a starting point that you adjust, and the adjustments are knowable in advance. Your region, your child care arrangement, your income, and how many children you have will move your figure well away from the national middle. A family in a low-cost area with relatives nearby can land near the bottom-third figure. A family in an expensive metro paying for full-time infant care can pass the top-third figure without feeling extravagant.
Plan the front-loaded years separately from the rest. Child care is the expense that arrives immediately, ends around school age, and does the most damage to a household’s ability to save during the years when compounding has the longest runway. A budget that survives the first five years intact protects far more than five years of savings.
Remember what the estimate leaves out. College is not in it. Nothing after age 17 is in it. Lost earnings and slowed career progression are not in it, and for two-earner households those often exceed several years of direct costs. Anyone building a real plan should treat $329,264 as the floor on a middle-income child, and never as the ceiling.
The last thing worth carrying away is the shape of the two lines in the figure. Spending compounds nowhere. Invested money compounds relentlessly. Understanding that difference does not tell you how to live, and it does tell you what any long-running commitment is really worth. That is a fact worth having in front of you before you build the budget, and it is one that a headline number, quoted without its conditions, will never give you.
Sources
- U.S. Department of Agriculture, Center for Nutrition Policy and Promotion, Expenditures on Children by Families, 2015, Miscellaneous Report No. 1528-2015, Mark Lino, Kevin Kuczynski, Nestor Rodriguez and TusaRebecca Schap, January 2017, revised March 2017. Headline total of $233,610 in 2015 dollars for a middle-income married-couple family with two children, birth through age 17; income-group totals of $174,690 and $372,210; table 1 annual expenditures by age; regional and family-size adjustments; the 1960 comparison; the exclusion of college, post-17 costs, and indirect costs; the $284,570 future-inflation projection. https://fns-prod.azureedge.us/sites/default/files/resource-files/crc2015-march2017.pdf
- U.S. Department of Agriculture press release, “Families Projected to Spend an Average of $233,610 Raising a Child Born in 2015,” January 9, 2017. https://www.usda.gov/about-usda/news/press-releases/2017/01/09/families-projected-spend-average-233610-raising-child-born-2015
- Child Care Aware of America, Child Care in America: 2025 Price & Supply, published 2026. National average annual price of child care of $13,184 in 2025; shares of two-parent and single-parent median income; comparisons to in-state public college tuition and median rent. https://info.childcareaware.org/media/child-care-prices-rival-major-household-expenses
- Consumer Price Index and S&P 500 real total return, splicing Robert J. Shiller’s S&P Composite and CPI series to the S&P 500 total return index and CPIAUCSL from FRED. Used for the 2015 to 2026 inflation adjustment and the 18-year real total-return path.