The number 500 in the S&P 500 promises a wide net. The weighting rule underneath it quietly hands most of your money to ten companies. By year-end 2025 those ten were about 41 percent of the whole index, per RBC Wealth Management and FactSet, which means a fund most people buy for safety is leaning harder on a handful of names than it has at any point on record.
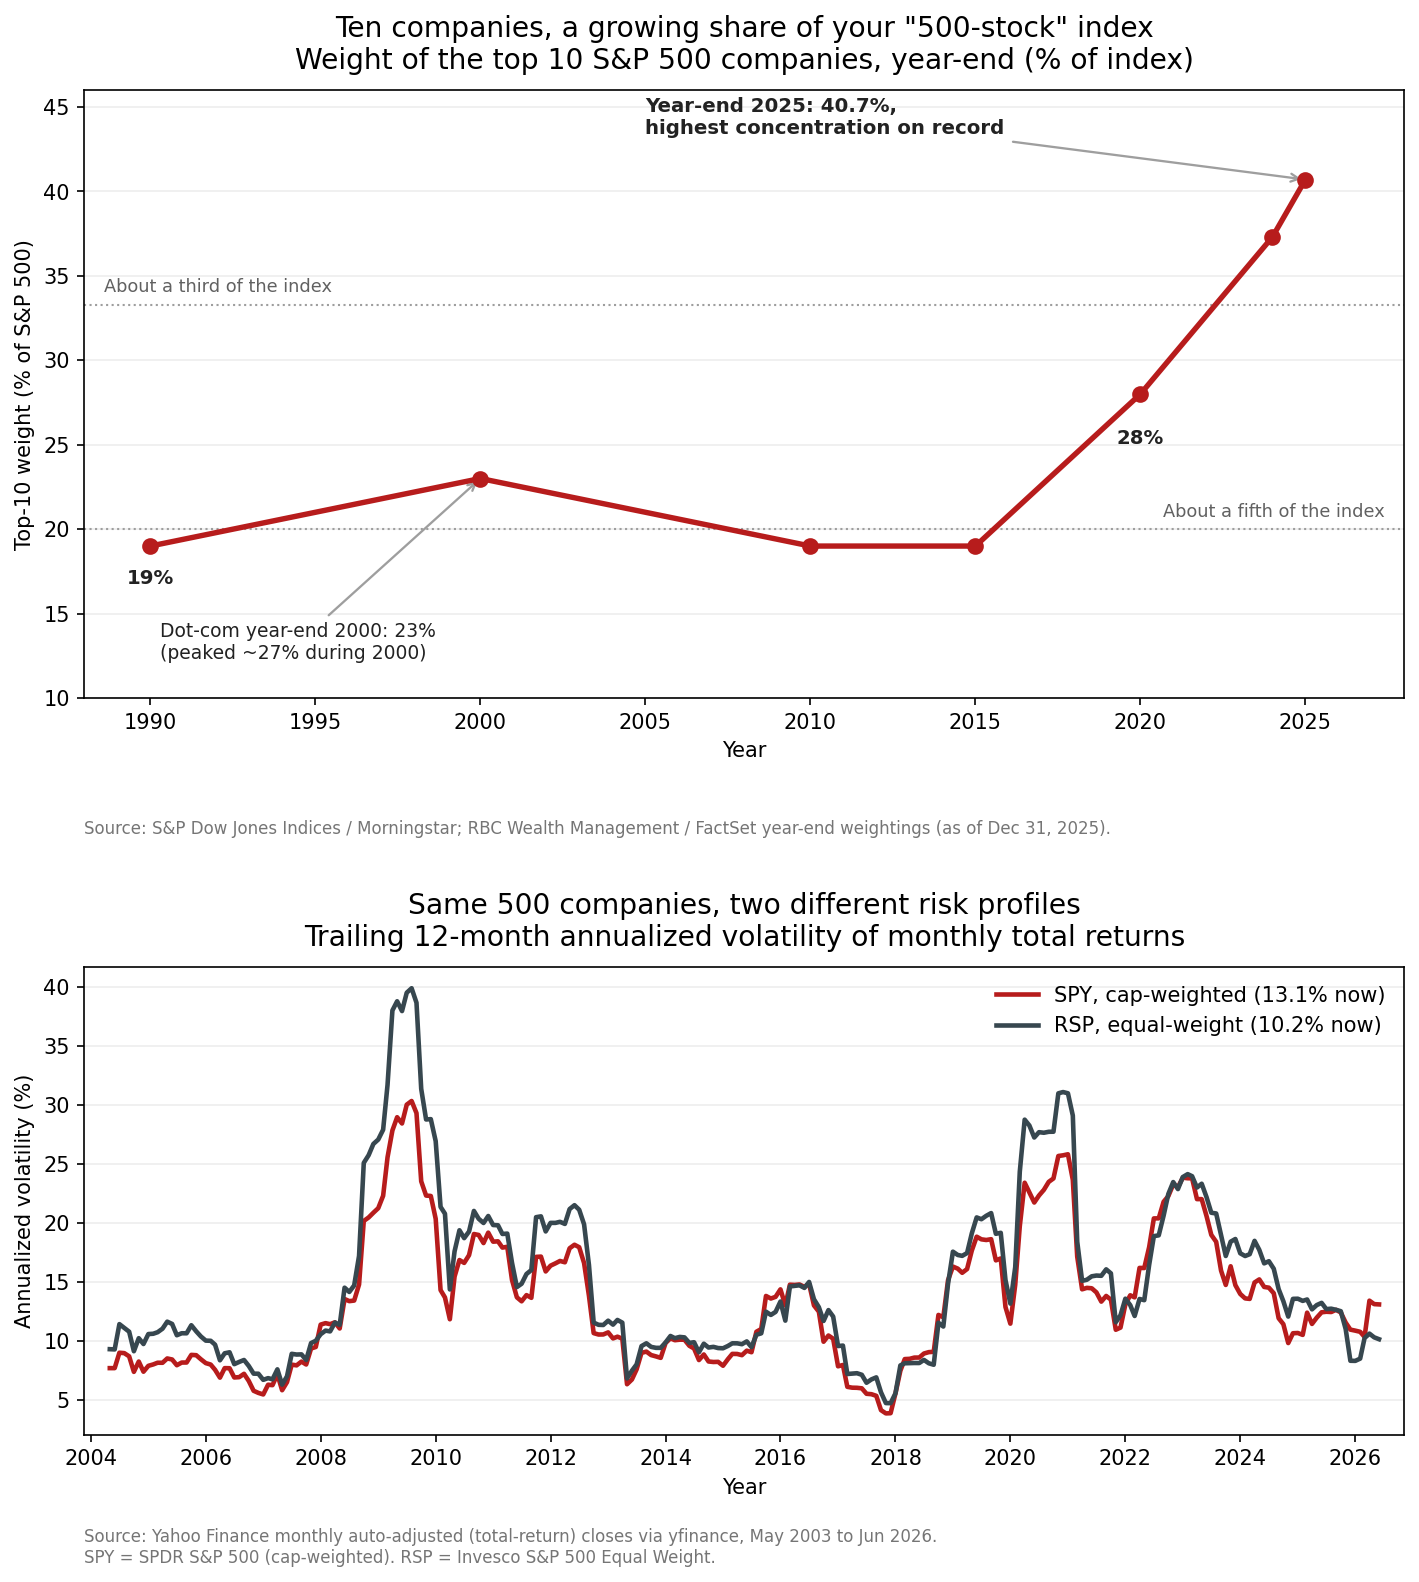
Owning an index feels like the opposite of a concentrated bet. You buy one ticker and, in theory, you own a slice of 500 businesses spread across every sector of the economy. The theory holds only if those 500 slices are anywhere near the same size. In the S&P 500 they are not, and the gap between the biggest slice and the smallest has widened into something a careful holder should measure before assuming they are diversified. This article is about that gap, what created it, and what it does to the risk you actually carry. The figure tells the story in two panels: the top one tracks how much of the index the ten largest companies have claimed at each year-end since 1990, and the bottom one compares the volatility of the cap-weighted index with an equal-weight version of the same 500 stocks.
How cap-weighting concentrates an index
The S&P 500 is market-cap weighted, maintained by S&P Dow Jones Indices. Each company’s weight equals its market capitalization, meaning share price times shares outstanding, divided by the total market value of all members. A three-trillion-dollar company gets thirty times the weight of a hundred-billion-dollar company. That single rule decides how much of every dollar you invest lands on each name.
The rule has a feedback loop built into it. When a company’s stock rises faster than the rest of the index, its market cap grows faster, so its weight climbs, so it exerts more pull on the index level, and every new dollar into an index fund buys proportionally more of it. Winning begets weight, and weight begets influence. Nothing about this is a defect. It is the mechanism working exactly as designed. The consequence is that a cap-weighted index concentrates on its own whenever a few members pull away from the field, with no committee deciding to make that bet on your behalf.
This is why the count of holdings tells you so little. A fund can hold 500 names and still behave like a wager on ten of them, because the other 490 have been compressed into slices too thin to matter. The label reports the headcount. The weighting rule reports the truth, and the truth moves every year the largest names lead.
What the top-ten weight has done since 1990
The top panel of the figure plots the weight of the ten largest S&P 500 companies at year-end, from 1990 forward, drawn from numbers published by S&P Dow Jones Indices, Morningstar, and RBC Wealth Management with FactSet. The shape of that line is the whole argument.
For a quarter century the number sat in a narrow band. At year-end 1990 the top ten were about 19 percent of the index, roughly a fifth. Through the 1990s the band held near a fifth to a quarter. At the 2000 year-end, after the technology run of the late nineties, the top ten stood near 23 percent, having touched about 27 percent during that year, according to numbers cited by S&P Dow Jones Indices. Then concentration receded. By year-end 2010 and again at year-end 2015 the top ten were back near 19 percent, a fifth of the index, the same neighborhood they had occupied two decades earlier. For a long stretch, in other words, a broad-market fund really was broad.
The climb since then breaks the pattern. By year-end 2020 the top ten had reached about 28 percent, per Morningstar and S&P Dow Jones Indices reporting. By year-end 2024 they were 37.3 percent, and by year-end 2025 they hit 40.7 percent, the highest reading in the record, according to RBC Wealth Management and FactSet data as of December 31, 2025. The top-ten weight roughly doubled in a single decade. The dotted lines in the figure mark a fifth and a third of the index, and the series has now punched clear through both. A holder who bought the S&P 500 in 2015 for its breadth owns something materially more concentrated today without having changed a thing.
Two features of that history matter for anyone reading this later. Concentration is not a one-way ratchet. It rose into 2000, fell for fifteen years, and rose again, so the current record is a level, not a destiny, and it will read differently whenever you check it. That is why every number here carries a date. The direction that has held since roughly 2016 is up, and the current altitude is unusual by any historical standard.
The 1972 and 2000 parallels
Concentration this steep has happened before, and the two clearest precedents bear direct comparison with today. The first is the Nifty Fifty era of the early 1970s. A group of large, admired growth companies, names like the era’s dominant consumer and technology franchises, commanded a huge share of the market and traded at extreme valuations, with the group’s average price-to-earnings ratio reaching roughly 42 times earnings, more than double the broad market, according to accounts of the period. By late 1972 the five largest stocks were about 23 percent of the S&P 500. When inflation and the 1973 to 1974 bear market arrived, the most crowded names fell hardest, and the concentration unwound painfully.
The second precedent is the dot-com peak of 2000, visible as the small hump in the figure. The top ten reached about 27 percent during that year on the strength of a narrow set of technology and telecom leaders. The years that followed were the lost decade for the cap-weighted index, and the equal-weight version of the same 500 companies went on to beat it handily as the crowded names deflated and the rest of the market caught up.
Today’s concentration sits above both of those peaks. The comparison that anchors the modern reading is that the top ten passed 40 percent by late 2025, and the top five reached about 23 percent as early as August 2020, described at the time as the highest such reading since 1972. The parallel is not a forecast. Concentration has stayed elevated for years before, and betting on an imminent reversal has been a good way to miss returns. The parallel is a reminder that when a few names carry the index, the index inherits their fate, and history offers examples of that fate turning sharply.
One difference makes today’s version its own animal. In 1972 and even in 2000, the crowd at the top spanned somewhat different businesses. Today the largest names are bound by a single theme, the buildout and monetization of artificial intelligence, which links their fortunes more tightly than a list of ten separate companies would suggest. Reporting through 2025 noted that the top ten were priced to represent roughly 41 percent of the index’s weight while accounting for closer to 32 percent of its earnings, a premium that only pays off if the theme delivers.
What concentration does to your risk
The reason to measure any of this is that concentration changes the risk you hold, in three concrete ways.
The first is single-company exposure. When the largest member approaches 8 percent of the index, as the biggest S&P 500 stock has at points in 2025 per S&P Dow Jones Indices weightings, one company’s bad quarter moves your “diversified” fund by an amount a truly even split across 500 names could never produce. You did not choose to make that company 8 percent of your portfolio. The weighting rule chose it for you, and it chose more of whatever had already risen most.
The second is single-sector exposure. Cap-weighting concentrates by sector as fast as it concentrates by company. The S&P 500 Information Technology sector alone was about 31.9 percent of the index as of 2026, according to S&P Dow Jones Indices, and that number understates the true technology tilt because some of the largest technology-driven businesses are classified under communication services and consumer discretionary. A fund sold as a bet on the American economy is, in weighted reality, close to a one-third bet on a single sector’s outcome.
The third is drawdown sensitivity. When a few names drive most of the index’s movement, a decline concentrated in those names drags the whole index down further than the average stock would justify. The bottom panel of the figure gets at this by running the identical basket two ways. SPY is the SPDR S&P 500 ETF, cap-weighted. RSP is the Invesco S&P 500 Equal Weight ETF, which holds the same 500 companies at roughly equal weight. I pulled monthly total-return prices for both from Yahoo Finance and computed each fund’s trailing twelve-month annualized volatility, meaning the standard deviation of its monthly returns scaled to a yearly rate.
The result is honest and a little counterintuitive. Across the full window since 2003, equal-weight RSP was actually the more volatile of the two, averaging about 15.1 percent annualized against 13.4 percent for cap-weighted SPY, because equal weighting tilts toward smaller and more cyclical companies that swing harder in a panic. Concentration is not automatically more volatile day to day. What has changed is recent. As of 2026, the latest complete month in the data, cap-weighted SPY’s trailing volatility was 13.1 percent while equal-weight RSP’s was 10.2 percent, so the cap-weighted version was the more volatile by about 3 percentage points. The identical 500 companies, weighted by size, now carry more risk than the same companies weighted evenly. That flip is the fingerprint of concentration, and it is a reading for a specific month that will move as the leaders move.
Put the three together and the picture is clear. Buying the cap-weighted index today gives you a large stake in a few companies, a large stake in one sector, and a return that increasingly rises and falls with a short list of names. None of that is visible in the number 500.
The responses, and what to check
Two responses to concentration are worth naming briefly. The first is equal weighting, the RSP approach, which holds the same 500 companies but rebalances them to equal slices, capping any single name’s influence and tilting the fund back toward the average company. It is no free lunch. It trades single-name concentration for a heavier tilt to smaller, more cyclical firms, which is why it fell further than the cap-weighted index in the 2008 panic, and it has trailed cap-weight during the years the giants led. The second response is diversifying beyond the S&P 500 entirely, into international equities and other asset classes, so that a stumble in a handful of American mega-caps is not a stumble in your whole portfolio. Both are ways of buying back the diversification the label implied and the weighting rule quietly removed.
You do not have to act on any of this. You do have to measure it, because the risk is invisible until you look. Three checks take a minute. Look up the current weight of the top ten holdings in any cap-weighted fund you own, and write down the date, since a top-ten weight near 40 percent, as S&P Dow Jones Indices and Morningstar reported for late 2025, means your broad fund is leaning hard on a few names right now. Look up the largest sector’s share for the same reason. Then decide, with those numbers in front of you, whether the thing you own matches the diversification you thought you were buying. The name says 500. The weighting rule has been saying something narrower every year, and lately it has been saying it loudly.