Multiply a home’s price by 5 percent, divide by 12, and compare the result to a month’s rent. That single line decides more of the buy-versus-rent question than any granite countertop or school district, and most people never run it. Instead they run a slogan, “renting is throwing money away,” which is the most expensive four words in personal finance because it hides the money that owning throws away too.
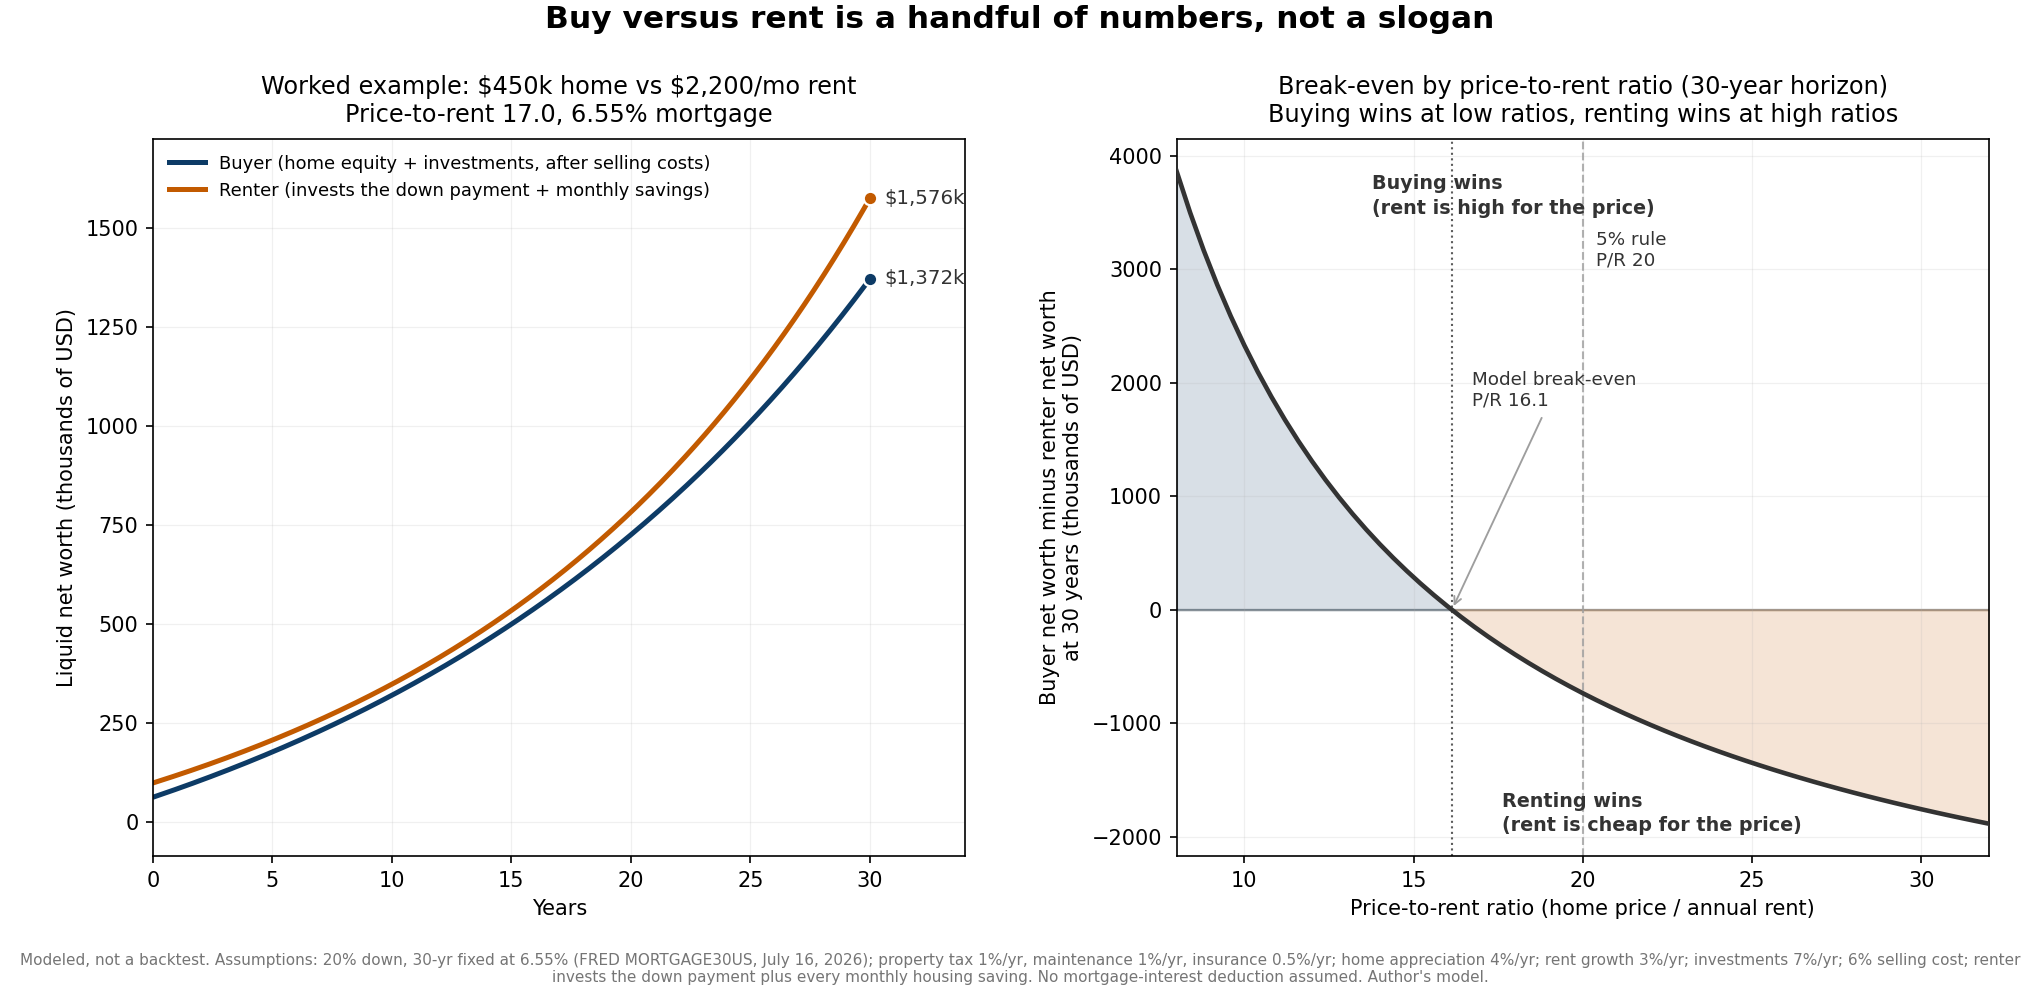
Owning has its own leaks that never build a dollar of equity. Property tax leaves and does not come back. Maintenance leaves and does not come back. The interest on the mortgage leaves, and the return you gave up by locking a large down payment into drywall leaves too. Whether buying beats renting comes down to a handful of numbers most people never separate out, and once you do separate them the honest answer points either way depending on two variables, the price-to-rent ratio and the mortgage rate. I built a transparent, month-by-month model that pits a buyer against a renter who invests every dollar of difference, fed it the current 30-year mortgage rate from the Federal Reserve, and let it find where the line falls. The 30-year fixed rate averaged 6.55 percent as of 2026, according to FRED series MORTGAGE30US, and that number, more than any other, is what moves the answer today. The chart below shows both halves of the result: one household’s thirty-year race on the left, and where break-even falls across price-to-rent ratios on the right.
The Five Percent That Never Comes Back
Ben Felix of PWL Capital popularized a clean way to think about the leaks, and it is the frame for everything here. He calls it the 5 percent rule. The idea is to add up the unrecoverable costs of owning, the money that leaves your pocket every year and buys you no equity, and express them as a share of the home’s value. Property tax runs about 1 percent of the home’s value a year in a typical US jurisdiction. Maintenance runs about another 1 percent a year, because roofs, water heaters, and paint wear out on a schedule whether you notice or not. The third piece is the cost of capital, roughly 3 percent, which is the real return you forgo by tying money up in the house instead of investing it, blended across the down payment you locked in and the mortgage interest you pay. Add them and you get about 5 percent of the home’s value a year in pure cost, none of it recoverable.
That gives you a test you can run in your head. Take the home’s price, multiply by 5 percent, divide by 12, and you have the monthly cost of owning that never comes back. For a 450,000 dollar home that is 22,500 dollars a year, or 1,875 dollars a month. If a comparable home rents for less than that, renting and investing the difference has tended to win, because your all-in cost of owning already exceeds the rent before you have built a cent of equity. If comparable rent costs more than 1,875 dollars, buying starts to look better. The elegant part is that the 5 percent rule is really a statement about one ratio. Break-even rent equals 5 percent of the price, so the price divided by that annual rent is exactly 20. The 5 percent rule and a price-to-rent ratio of 20 are the same fact wearing two outfits.
There is a catch that matters a great deal in 2026. Felix’s 3 percent cost of capital was calibrated to a world of cheap mortgages. When you can borrow at 3 percent, the interest leak is small. At 6.55 percent, the money you borrow costs more than twice that, so the true unrecoverable cost sits above 5 percent, and the break-even tilts toward renting. This is why a rule of thumb is a starting point, and the full model is where the real number lives.
A Worked Example Over Thirty Years
Consider a concrete case, and hold every assumption in view so you can argue with any of them. The home costs 450,000 dollars. The buyer puts 20 percent down, which is 90,000 dollars, and finances 360,000 dollars over 30 years at the 6.55 percent rate above. That fixes the monthly principal and interest at 2,287 dollars in my model. On top of that the buyer pays property tax at 1 percent of the home’s value a year, maintenance at 1 percent, and homeowners insurance at 0.5 percent, so the all-in housing cost starts near 3,225 dollars a month. The home appreciates at 4 percent a year in nominal terms, which is roughly 1 percent above my 3 percent inflation assumption, in line with the long-run real appreciation in Robert Shiller’s home-price record, not the frothy pace of any single boom. When the buyer eventually sells, a 6 percent selling cost comes out of the price. I assume no mortgage-interest deduction, because since the 2017 standard-deduction increase most homeowners no longer itemize.
The renter in this comparison pays 2,200 dollars a month to start, a price-to-rent ratio of 17, and does the disciplined thing that makes the comparison fair. The renter invests the 90,000 dollar down payment plus the roughly 9,000 dollars in closing costs the buyer had to pay, and every single month the renter invests the gap between the buyer’s higher housing cost and the rent. Both parties’ investments compound at 7 percent a year nominal, and the renter’s rent grows at 3 percent a year with inflation. The rule is symmetric. Whichever party has the cheaper housing bill in a given month invests the surplus, so neither side gets a free hand.
The model tracks both net worths month by month, netting selling costs out of the buyer so the two numbers are comparable liquid wealth. At this price-to-rent ratio and this mortgage rate, the renter stays ahead the entire way. After 10 years the buyer holds about 321,000 dollars in modeled net worth and the renter about 349,000 dollars. After 20 years it is roughly 726,000 for the buyer against 783,000 for the renter. After 30 years, with the mortgage finally paid off and the house owned free and clear, the buyer sits near 1.37 million dollars and the renter near 1.58 million. The gap is about 200,000 modeled dollars, and it never closes, because the head start from investing that 99,000 dollar lump sum plus the early monthly savings compounds for three decades. The left panel of the figure is that race. The two lines rise together, and the orange renter line stays a nose ahead the whole track.
That result should bother anyone who repeats the throwing-money-away slogan. At a price-to-rent ratio near the national middle and a mortgage rate near 6.5 percent, the renter who invests the difference does not fall behind. The rent check is not the whole cost of renting, and it is not the whole cost of owning either.
Break-Even Lives at the Price-to-Rent Ratio
One example proves nothing on its own, so the right panel of the figure sweeps the entire question. It holds the home price and the mortgage rate fixed and varies only the rent, which is the same as varying the price-to-rent ratio, then plots the buyer’s 30-year net worth minus the renter’s. Where the curve sits above zero, buying wins. Where it dips below, renting wins. The crossover is the break-even, and in this model at 6.55 percent it lands at a price-to-rent ratio of about 16.1, meaning a break-even rent near 2,324 dollars a month for the 450,000 dollar home.
Read the two ends of that curve to feel how much the ratio matters. At a price-to-rent ratio of 12, where a 450,000 dollar home would rent for about 3,125 dollars a month, buying wins enormously in the model, roughly 2.07 million dollars of net worth against 762,000 for the renter, because rent that high makes owning the obvious bargain. At a ratio of 20, the exact point the 5 percent rule flags as break-even, this model at today’s rate has the renter ahead by about 735,000 dollars after 30 years. That divergence between the rule and the model is the interest rate talking. The 5 percent rule’s implied break-even of 20 was honest when mortgages were cheap. At 6.55 percent the model pulls break-even down to about 16, so a band of price-to-rent ratios between 16 and 20, which looks like buying territory under the rule of thumb, is actually renting territory once you price the mortgage in.
This is where the map of the country comes in. Price-to-rent ratio is exactly the metric Zillow makes computable, since Zillow publishes both a home-value index and an observed-rent index for metros nationwide, and dividing one by the other gives the ratio for any market. The dispersion is enormous and durable. Expensive coastal metros, the California Bay Area and Los Angeles among them, have long carried price-to-rent ratios well north of 25, which is deep renting territory in this model. Much of the industrial Midwest and the older parts of the Northeast have historically run near or below 12, which is buying territory by a wide margin. The national figure sits somewhere in the middle teens. The same 450,000 dollar house, financed at the same rate, is a good buy in one metro and a poor one in another, and the deciding number is not the price alone but the price measured against what the identical house rents for.
Interest Rates Move the Whole Answer
The mortgage rate deserves its own look, because it swings break-even as hard as the ratio does. I reran the model at three rates while holding everything else fixed. At a 4 percent mortgage, close to what buyers saw in 2021, break-even sits at a price-to-rent ratio of about 19.6, almost exactly the 5 percent rule’s 20, so buying wins across most of the country. At the current 6.55 percent, break-even falls to about 16.1. At 8 percent, break-even drops to about 14.5, and only genuinely cheap markets favor buying. The reason is direct. A higher rate lifts the monthly principal and interest, from about 1,719 dollars at 4 percent to 2,287 dollars at 6.55 percent on the same 360,000 dollar loan, and every extra interest dollar is unrecoverable. The rate a buyer locks is not a detail to shop for after deciding to buy. It is part of deciding.
Because the model is transparent, it is worth stress-testing the one assumption a buyer has the least control over, home appreciation. My base case uses 4 percent nominal, about 1 percent real. If you believe homes will appreciate at 5 percent nominal, roughly 2 percent real, break-even rises only to a price-to-rent ratio of about 17.1. If homes merely keep pace with 3 percent inflation and deliver zero real appreciation, break-even falls to about 15.5. Appreciation matters, but over a realistic range it moves the break-even ratio by a point or so in either direction, while the mortgage rate moved it by five points across the range above. The rate is the louder variable, and it is the one you can actually observe today.
What the Model Cannot Price
This is a financial model, and it answers only the financial question. It says nothing about the value of painting a wall the color you want, of a landlord who cannot raise your rent or sell the building out from under you, or of staying put long enough that your children keep the same friends. Those are real reasons to own, and they are separate from the arithmetic. A homeowner buys stability and control, and pays for them partly in the unrecoverable costs the model just tallied. If those benefits are worth the modeled gap to you, that is a rational purchase, and no spreadsheet can veto it.
What the model does insist on is honesty about the price of that stability. Renting is not throwing money away, because a renter who invests the difference is buying the same thing an owner buys, exposure to a growing asset, through an index fund instead of a house, and paying far less to maintain it. Owning is not a guaranteed win, because the tax, the upkeep, and above all the interest at 6.55 percent are real money leaving your pocket every month for no equity. Run the one line first. Take the price, multiply by 5 percent, divide by 12, and set it beside the rent. Then, if the decision is close, run the full model with your own city’s price-to-rent ratio and the rate you can actually get. The slogan is free and usually wrong. The numbers are cheap and usually right.