In 2008 the S&P 500 lost about half its value, and 10-year Treasuries gained about 20 percent over the same months. That offset is the whole reason a balanced portfolio bothers to hold bonds. The stock sleeve is the growth engine and the bond sleeve is the shock absorber, and in a crash the absorber is supposed to push back while the engine seizes. For most of the last century it did exactly that. Then 2022 arrived, stocks fell about 19 percent, and the 10-year Treasury fell about 18 percent alongside them. The absorber turned into a second source of loss.
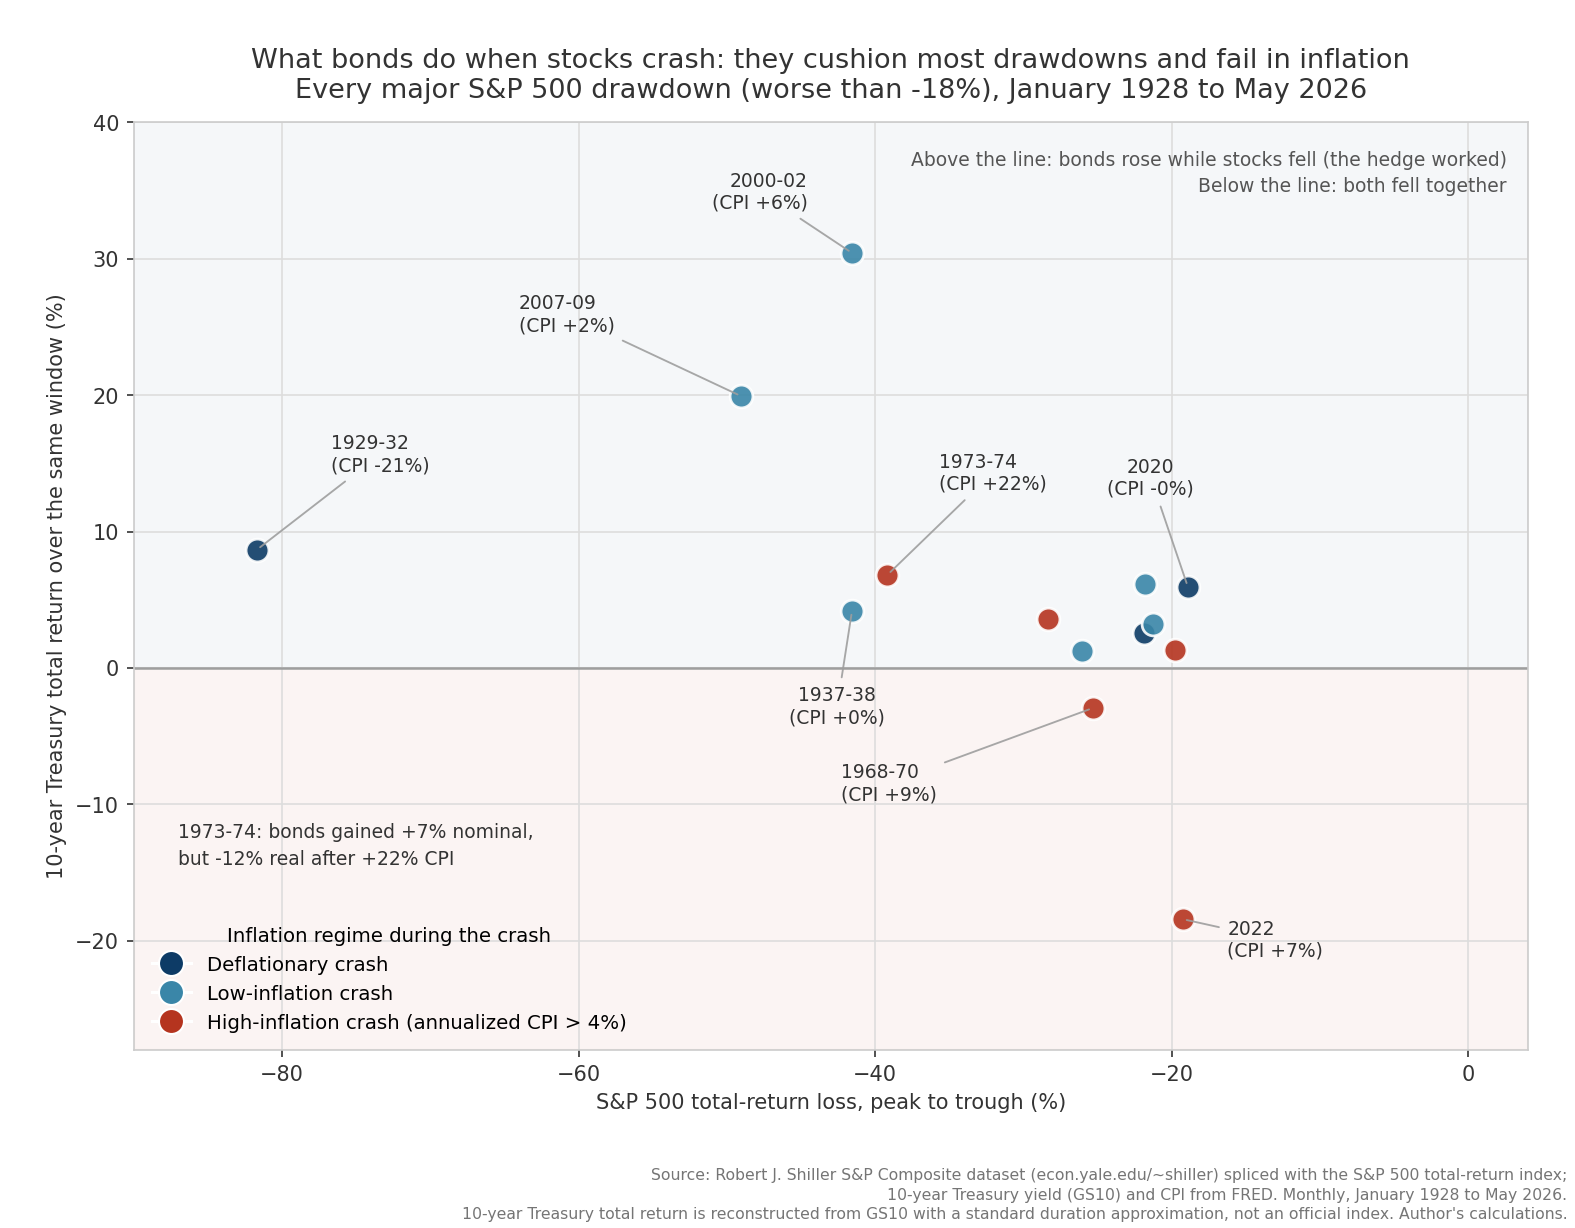
The question worth answering is not whether bonds hedge stocks, because the average answer hides the mechanism. The question is when they hedge and when they fail, and the record is clear enough to state as a rule. I rebuilt a 10-year US Treasury total return from the constant-maturity yield, detected every major S&P 500 drawdown from January 1928 to 2026 in the S&P 500 total-return series (Robert Shiller’s data spliced to recent prices), and measured what Treasuries did over each one. There were 14 drawdowns worse than 18 percent. Bonds gained in 12 of them and fell in 2, and the two failures share a single cause. All figures below are my calculations from that dataset. The chart below plots each crash, the stock loss against the bond’s return over the same window, colored by the inflation regime.
Why Treasuries Usually Rally When Stocks Fall
A Treasury bond is a contract to pay fixed coupons and return your principal at maturity. Its price moves opposite to interest rates, because a bond paying a fixed coupon becomes worth more when newly issued bonds pay less, and worth less when new bonds pay more. That inverse relationship is the mechanism behind everything that follows.
Two forces usually push Treasury prices up when stocks fall. The first is a flight to safety. When the economy looks fragile and stocks sell off, investors move money into the one asset that pays them back with near certainty, US government debt, and that buying pressure lifts bond prices. The second is monetary policy. A weakening economy pushes the Federal Reserve to cut short-term rates to cushion the slowdown, and expectations of those cuts pull longer-term yields down too, which lifts bond prices again. Both forces point the same direction in an ordinary recession. Stocks drop, yields fall, and the bond sleeve gains while the stock sleeve bleeds.
This is the same trick a control engineer uses to damp a system that overshoots. You do not remove the disturbance. You add a component whose response counteracts it, so the combined output oscillates less. The bond sleeve is a passive damper bolted onto an equity portfolio. When it works, the two halves move in opposition and the blended path is smoother than either half alone. The record shows it works most of the time, and it shows precisely when the damping reverses sign.
The Record Across Every Crash Since 1929
Read the figure as a simple test. Each point is one major stock crash. The horizontal axis is how far the S&P 500 total return fell from its peak to its trough, so points further left are worse crashes. The vertical axis is the 10-year Treasury total return over that same window. Above the grey line, bonds rose while stocks fell and the hedge worked. Below the line, both fell together. Color marks the inflation environment during the crash, from deflation in dark blue to high inflation in red.
The deep crashes, the ones investors actually fear, sit high above the line. In the 1929 to 1932 collapse the S&P 500 lost 81.7 percent over 33 months, and the 10-year Treasury gained 8.7 percent. Consumer prices fell 21.4 percent in that same span, so the bond’s real return was an enormous 38.2 percent, because holding a fixed stream of dollars while prices crater makes each dollar worth more. In the dot-com unwind from August 2000 to February 2003 stocks fell 41.6 percent and Treasuries gained 30.4 percent. In the 2007 to 2009 financial crisis stocks fell 49.0 percent and Treasuries gained 19.9 percent. Three of the worst equity drawdowns in the sample, and in every one the bond sleeve did its job with room to spare.
The 2020 COVID crash is the sharp case and the reason I detect drawdowns from the monthly peak and trough of the series, not by calendar year. The S&P 500 total return fell 18.9 percent from February to March 2020 on month-end closes, and much more than that intramonth. The 10-year Treasury yield collapsed from 1.50 percent at the end of February to 0.87 percent at the end of March, and the bond sleeve returned 5.9 percent while the world locked down. Fast crash, textbook hedge.
Taking the whole table together, Treasuries gained in 12 of the 14 major drawdowns since 1928. If you stopped counting there, you would conclude bonds are a reliable hedge and move on. The two exceptions are where the real lesson lives.
Why 2022 Broke the Hedge
The two crashes where bonds fell alongside stocks were the 1968 to 1970 bear market, where Treasuries lost 2.9 percent while consumer prices rose 9.3 percent, and the 2021 to 2022 selloff, where Treasuries lost 18.4 percent while consumer prices rose 6.9 percent. Both are colored red in the figure because both happened under high inflation, which I define here as an annualized consumer price increase above 4 percent during the crash. That shared color is the answer to the whole puzzle.
Bonds cushion stocks when the threat to stocks is a slowing economy, because a slowdown pushes yields down and bond prices up. In 2022 the threat was the opposite. Inflation ran near a four-decade high, and the Federal Reserve raised rates hard to fight it. Higher rates hurt stocks by shrinking the present value of future earnings, and they hurt bonds directly by repricing every fixed coupon against a higher discount rate. One shock, inflation, hit both assets through the same channel, so the two sleeves stopped offsetting and started falling together. The 10-year Treasury yield climbed from 1.47 percent at the end of 2021 to 3.98 percent at the trough in October 2022, and the bond sleeve fell 18.4 percent, almost exactly as far as the 19.3 percent stock decline.
The engineering way to say it is that the sign of the correlation between the two sleeves depends on what is driving the market. When recessions and deflation scares drive the crash, stock and bond returns move in opposition and the damper works. When inflation drives the crash, they move together and the damper reverses into a second oscillator pushing the same way. A hedge that only holds under one set of conditions is a conditional hedge, and knowing the condition is the difference between trusting the design and being surprised by it.
Duration, and the Nominal Trap in 1973
The size of a bond’s move in either direction is set by duration. Duration is the approximate percentage change in a bond’s price for a one percentage point change in its yield. In my reconstruction a 10-year Treasury yielding 4 percent has a modified duration near 8.1, so a one-point rise in yields knocks about 8 percent off its price before coupon income. That single number explains why long bonds swing hard in a crash. Multiply a duration near 8 or 9 by the two-and-a-half-point yield jump of 2022 and you get the high-teens loss the sleeve actually took. The same duration cuts the other way in a flight to safety. The 2000 to 2002 gain of 30.4 percent came from a high 5.83 percent starting yield collecting coupons while the yield fell to 3.90 percent, and long duration turned that yield decline into a large price gain on top.
A shorter-duration bond would have swung less in both directions. A two-year Treasury has a duration near 2, so it loses far less when rates spike and gains far less when they fall. That is the trade. Short bonds give up most of the crash cushion in exchange for a much smaller loss when the hedge fails. Investors who held short-term Treasuries or bills in 2022 barely moved while long-bond holders took double-digit losses, and the same investors gave up the powerful rallies that long Treasuries delivered in 2008 and 2020.
There is one more trap the figure exposes, and 1973 to 1974 is the case. The S&P 500 fell 39.2 percent, and the 10-year Treasury gained 6.8 percent, which looks like the hedge working. It was not. Consumer prices rose 21.8 percent over those same 23 months, so the bond’s real return, its return after inflation, was negative 12.3 percent. The nominal gain was an illusion painted by a currency losing value. This is why holding bonds in a high-inflation crash disappoints even when the number on the statement is positive. Across all 14 drawdowns, bonds gained in nominal terms 12 times but in real terms only 9 times, and every one of the real-terms failures was a high-inflation episode. The asset that protects you in a deflationary crash is the same asset that quietly erodes in an inflationary one.
What This Means for Holding Bonds Today
The rule that comes out of a century of data is short. Nominal Treasuries hedge a deflationary or flight-to-safety crash, the kind driven by recession fear, and they fail in an inflationary crash, the kind driven by rising prices and a central bank chasing them. A 60/40 portfolio is a bet that most future crashes will be the first kind. History says that bet wins far more often than it loses, since 12 of 14 major drawdowns since 1928 saw bonds cushion the fall, and the two losses clustered in the same rare condition.
If your worry is that the next crash could be the inflationary kind, the toolkit has answers that do not require abandoning bonds. Treasury Inflation-Protected Securities, or TIPS, are US government bonds whose principal rises with the consumer price index, so they defend the exact scenario where nominal Treasuries break, an inflation shock. Shortening the duration of the bond sleeve trades away crash cushion for a smaller loss when rates spike. Holding some cash or short bills does the same in a blunter way. None of these is free, and each gives up something in the deflationary crashes where plain long Treasuries shine. The right mix depends on which failure you are less willing to sit through.
What the data does not support is the 2022 conclusion that bonds are broken and a balanced portfolio is obsolete. The 10-year Treasury enters 2026 yielding about 3.84 percent, far above the 1.47 percent it paid going into 2022, which means the coupon cushion that was missing then is largely back. A bond bought at 3.84 percent has real room to rally if the next recession pulls yields down, and it pays you a meaningful income while you wait. The hedge was never unconditional. It was always a bet on the character of the next crash, and understanding the condition is what lets you hold the position through the year it does not work.