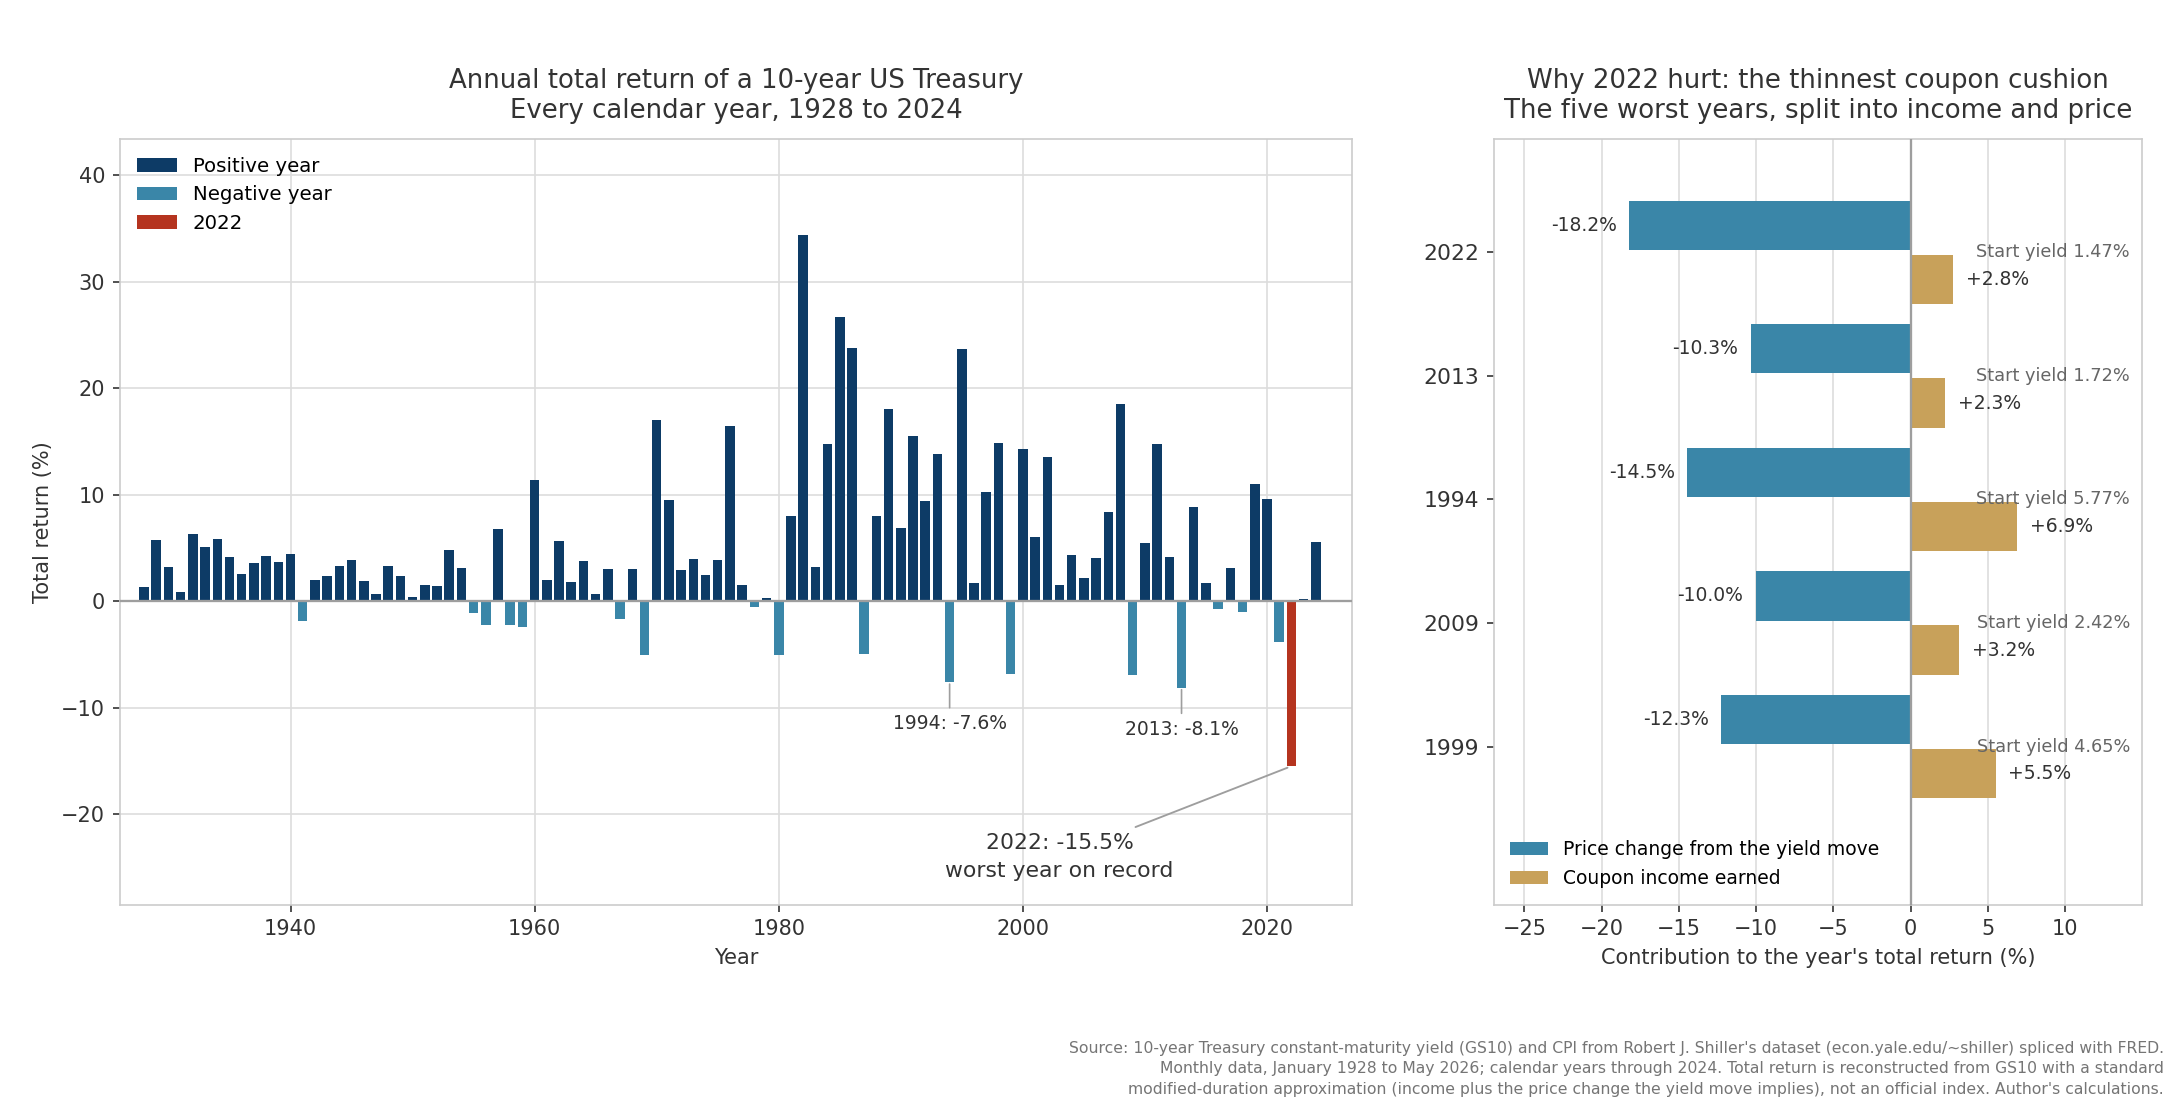
In 2022 a 10-year US Treasury lost about 15 percent. That is the worst calendar year for the safest asset in the portfolio since at least 1928, and it was not close.
The second worst year in my reconstruction is 2013, at negative 8.1 percent. The third is 1994, at negative 7.6 percent. So 2022 was roughly twice as bad as any bond year in the previous ninety-four. That result surprised a lot of people who had been told their bond sleeve was the boring, defensive half of the portfolio, and the surprise was not warranted. Everything that happened in 2022 falls out of one equation that fixed income professionals use every day. I rebuilt a 10-year Treasury total return from the constant-maturity yield in the dataset described at the end, then decomposed every calendar year from 1928 through 2024 into the income it earned and the price change its yield move forced. The 2022 result reproduces almost exactly from two numbers you could have known in advance. All numbers below are my calculations from that dataset unless another source is named. The chart below shows the whole record: every year’s total return on the left, with 2022 in red, and the five worst years split into income and price damage on the right.
Duration Is the Only Number That Matters
A bond is a schedule of fixed payments. Buy a 10-year Treasury and you have contracted to receive a set coupon every period and your principal back at maturity. Those cash flows never change. What changes is the rate at which the market discounts them, and that rate is the yield.
When yields rise, every one of those fixed payments is worth less today, so the price falls. When yields fall, the same payments are worth more and the price rises. The size of that reaction is what duration measures. Modified duration is the approximate percentage change in a bond’s price for a one percentage point change in its yield, and the relationship is close to linear over small moves:
price change ≈ negative duration × yield change
A bond with a modified duration of 9 loses about 9 percent of its price when its yield rises by one point, and gains about 9 percent when the yield falls by one point. That is the entire mechanism. There is no credit risk in a Treasury, no default to worry about, and no earnings report to disappoint. The only way a Treasury investor loses money over a year is for yields to rise by enough that the price loss overwhelms the income collected.
Duration itself depends on the yield. A bond priced at a low yield has most of its value concentrated in the distant principal repayment, because the near-term coupons are small, so its price is more sensitive to the discount rate. At the start of 2022 the 10-year Treasury yielded 1.47 percent, and a par bond at that yield carries a modified duration of about 9.2. At the start of 1994, when the yield was 5.77 percent, the same 10-year bond carried a duration of about 7.4. Low yields do two things at once. They shrink the income you earn, and they lengthen the duration that converts a yield move into a price loss. Both effects work against the holder in a selloff, which is why the 2022 setup was so unusually fragile.
The Arithmetic of 2022, Line by Line
Run the equation with the actual numbers. The 10-year Treasury constant-maturity yield ended 2021 at 1.47 percent and ended 2022 at 3.62 percent, a rise of 2.15 percentage points, according to the Federal Reserve’s GS10 series published on FRED. Multiply that move by the starting duration of 9.2 and the first-order price estimate is a loss of about 19.9 percent.
The realized price component in my monthly reconstruction is negative 18.2 percent, slightly better than the crude estimate because the yield move arrived in steps through the year and duration falls as yields rise, which is the convexity effect. Against that price loss the bond earned 2.8 percent in coupon income over the twelve months. Combine the two and the total return is negative 15.5 percent. The right panel of the chart above shows exactly this split for 2022 and for the four next-worst years.
Nothing in that calculation required a forecast of the economy. It required a yield forecast, which nobody has, and then simple multiplication. The reason 2022 felt like a shock is that most investors had never seen the multiplication carried out on their own holdings, so they had no intuition for how large a two-point yield move becomes when it passes through a duration of nine.
For calibration, the broader bond market told the same story with different numbers. The Bloomberg US Aggregate Bond Index returned negative 13.01 percent in 2022, its worst year since the index began in 1976, as reported by Bloomberg Index Services. That index carried a shorter average duration than a single 10-year Treasury, around six years at the time, which is precisely why its loss was smaller. Same equation, smaller multiplier.
Why There Was No Cushion
Compare 2022 with 1994, the year that used to be the reference point for a bond selloff. In 1994 the Federal Reserve doubled the federal funds rate over twelve months and the 10-year yield rose from 5.77 percent to 7.81 percent, a move of 2.04 points. That is almost identical in size to the 2.15 point move of 2022. The price damage in 1994 came to negative 14.5 percent, a little less than 2022 because duration was shorter at the higher starting yield.
The difference in what investors actually experienced comes from the income line. A bond bought at 5.77 percent paid 6.9 percent in coupon income over 1994, which absorbed nearly half the price loss and left a total return of negative 7.6 percent. A bond bought at 1.47 percent paid 2.8 percent over 2022, which absorbed about a sixth of the price loss. The yield shock was the same magnitude. The buffer standing behind it was less than half as thick.
This is the sense in which a starting yield is a margin of safety. Income accrues no matter what prices do, so it sets a floor under the year. At a 6 percent starting yield, roughly a 0.8 point rise in yields is enough to wipe out the year’s income and push the total return negative. At a 1.5 percent starting yield, a move of about 0.16 points does it. The lower the yield, the smaller the shock required to produce a loss, and the thinner the offset against a large one.
Going into 2022 the 10-year Treasury sat at the second lowest year-start yield in the entire ninety-seven year sample. Only 2021, which opened at 0.93 percent, was lower. That is the whole setup. The most rate-sensitive version of the bond, offering nearly the least income in recorded history, met the fastest tightening cycle since the early 1980s. The Federal Reserve raised its target range from 0 to 0.25 percent in March 2022 to 4.25 to 4.50 percent by December, seven increases in nine months, according to the Federal Open Market Committee’s published decisions. A portfolio built on the assumption that bonds move a few percent a year had no defense against that.
The damage also did not stop at the calendar boundary. Compounding 2021, 2022, and 2023 together gives a cumulative loss of about 18.5 percent for the 10-year Treasury. After inflation the picture is worse still. In 2022 alone, with the consumer price index up 6.5 percent from December to December according to the Bureau of Labor Statistics, the real total return was negative 20.6 percent.
Why Stocks Fell at the Same Time
The second half of the 2022 shock was that the equity sleeve offered no rescue. The S&P 500 returned about negative 18 percent on a total-return basis that year, according to S&P Dow Jones Indices, so both halves of a balanced portfolio fell hard together.
That correlation is a feature of the regime, and it follows from the same discounting logic. A stock is also a stream of future cash flows discounted at a rate, and that rate contains the same risk-free yield that prices the Treasury. When the risk-free curve shifts up by two points, every long-duration asset gets repriced downward. Growth equities, whose expected earnings sit furthest in the future, behave like very long bonds under this shift, which is why they fell hardest in 2022.
Bonds usually cushion an equity crash because the usual equity crash is a growth scare. Demand weakens, the Federal Reserve cuts, yields fall, and the bond sleeve gains while the stock sleeve bleeds. The 2022 shock arrived through the opposite channel. Inflation reached 9.1 percent year over year in June 2022, the highest reading since 1981 according to the Bureau of Labor Statistics, and the policy response to inflation is higher rates. One shock hit both assets through one channel, so the two sleeves stopped offsetting and started reinforcing. The hedge inside a 60/40 portfolio was always conditional on the character of the shock, and 2022 delivered the wrong character.
What Higher Starting Yields Change
The useful conclusion runs forward, because the same equation that explains the damage also describes the position an investor holds today. As of the most recent month in my dataset, 2026, the 10-year Treasury yields 3.84 percent, with a modified duration of about 8.2. Compare that with the 1.47 percent and duration 9.2 of January 2022. Income is more than double, and price sensitivity is about 11 percent lower.
Run the breakeven the same way. At 3.84 percent, yields would need to rise by roughly 0.47 points over a year before the price loss consumed the coupon income and turned the total return negative. In January 2022 that threshold sat near 0.16 points. The cushion is roughly three times thicker than it was, which makes this a meaningfully different asset even though the ticker is identical.
The same arithmetic works in the other direction, which is what makes bonds a hedge again. A one point decline in yields from 3.84 percent, the kind of move a recession typically produces, would deliver an 8 percent price gain on top of the coupon, for a total return in the low double digits. That optionality barely existed in 2021, when the yield had almost no room left to fall.
Over the full 1928 to 2024 sample, the reconstructed 10-year Treasury returned 4.60 percent a year with 5.4 percent annualized volatility, and a 60/40 blend with the S&P 500 returned 8.27 percent a year. Eighteen of the ninety-seven years were negative, so roughly one bond year in five loses money and always has. What changed in 2022 was the depth of a single loss, and that depth traced back to a starting yield near a record low.
The lesson worth carrying is that a bond’s risk is knowable in advance in a way that a stock’s risk is not. Look up the duration of whatever fund holds your fixed income, look up its current yield, and you can calculate your own worst case in about ten seconds. Anyone who ran that calculation in January 2022 saw a bond that would lose roughly nine percent for every point yields rose, against 1.47 percent of income to absorb it. The information was public and the arithmetic was elementary. What was missing was the habit of doing it.
Sources
- Robert J. Shiller, US Stock Markets 1871 to Present and CAPE Ratio dataset, econ.yale.edu/~shiller/data.htm. Source of the long-history 10-year Treasury yield (GS10), CPI, and S&P Composite series.
- Federal Reserve Bank of St. Louis (FRED), series
GS10(10-year Treasury constant maturity rate) andCPIAUCSL(consumer price index), used to extend the history to the latest month. - Federal Open Market Committee, 2022 policy statements and the target federal funds rate range, federalreserve.gov.
- US Bureau of Labor Statistics, Consumer Price Index news releases, 2022.
- S&P Dow Jones Indices, S&P 500 annual total return.
- Bloomberg Index Services, Bloomberg US Aggregate Bond Index, 2022 annual return.