In December 1996 the Fed chairman warned of irrational exuberance. Anyone who sold that day watched the S&P 500 double before the crash came. That episode is why the AI valuation debate keeps circling one question: is this 1997, with years of boom still ahead, or 1999, with the top a few months out? Strong opinions are cheap on both sides. What is scarce is a dated list of the actual numbers with their sources attached.
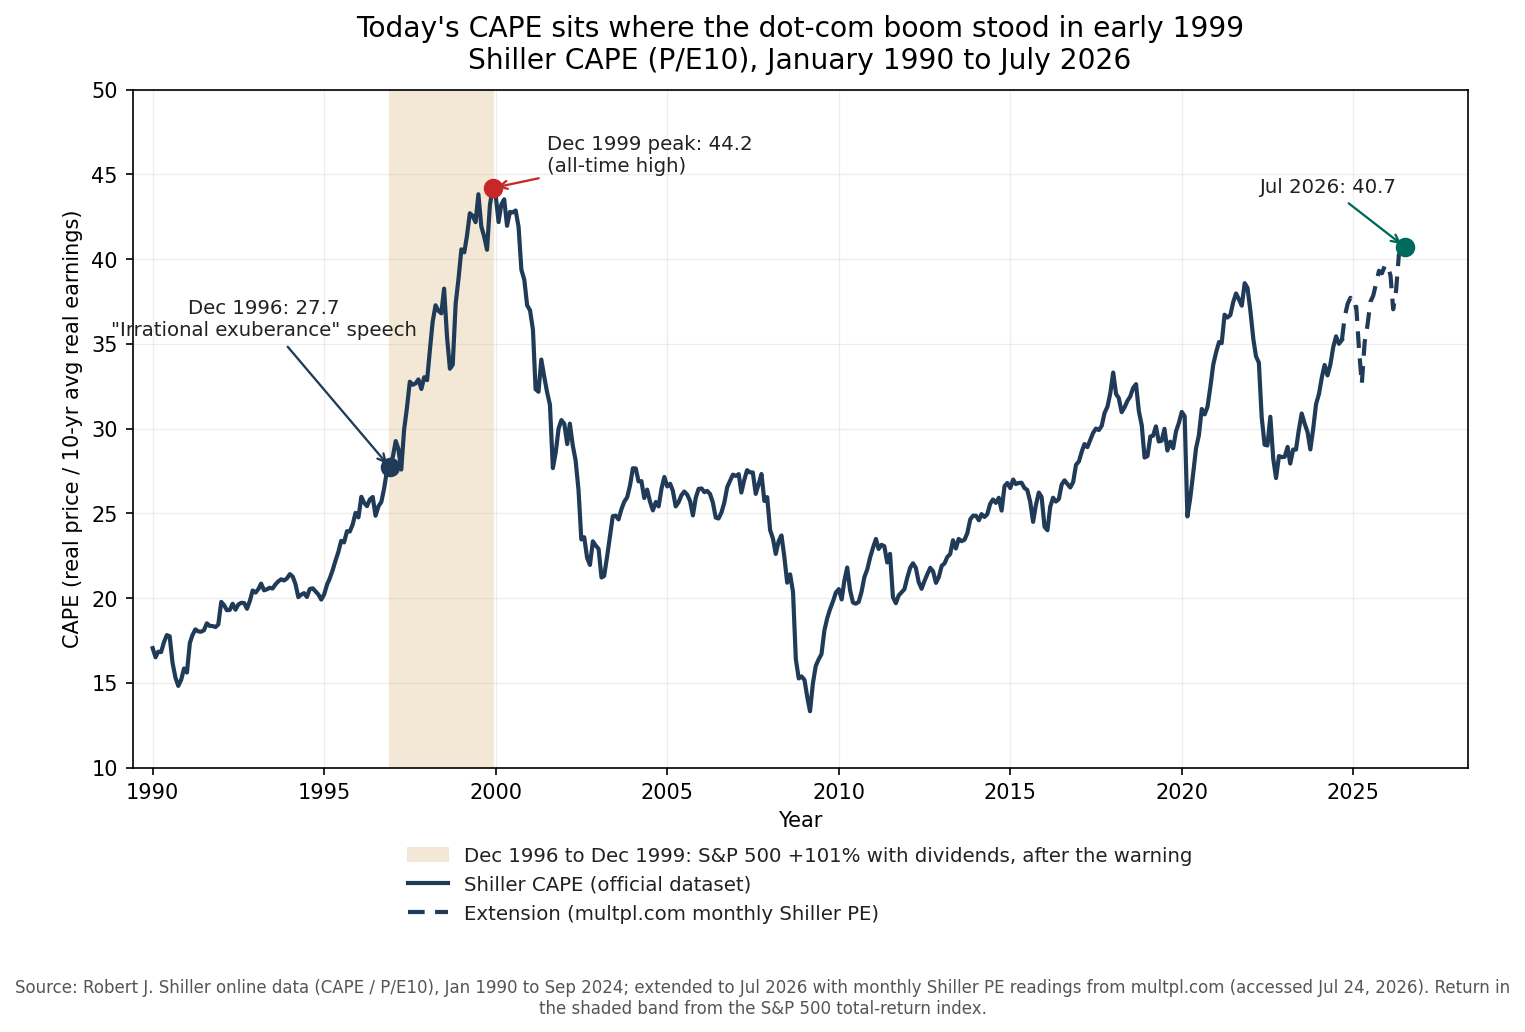
So I pulled them. The bubble-callers and the bubble-deniers turn out to cite the same three measurements: the market’s valuation, its concentration, and the earnings of the companies leading it. The disagreement is entirely about interpretation, which is worth knowing before you let either camp near your portfolio. The figure below plots the first of those measurements, the Shiller CAPE from January 1990 through 2026, with the 1996 warning, the 1999 peak, and today’s reading marked on the dot-com timeline.
The valuation number, dated
The cyclically adjusted price-to-earnings ratio divides today’s inflation-adjusted S&P 500 price by the average of the last ten years of inflation-adjusted earnings, which smooths the business cycle out of the denominator. Robert Shiller’s published dataset carries it back to 1881. As of 2026, the CAPE stands at 40.5, and the July monthly reading is 40.7. The all-time peak is 44.2, set in December 1999.
Now place today on the dot-com clock. When Alan Greenspan gave the irrational exuberance speech on December 5, 1996, the CAPE was 27.7. It crossed 32.6, the level that had marked the 1929 peak, in July 1997. It first crossed 40 in January 1999, and it first touched today’s 40.7 in March 1999. Measured by this ruler, the market is standing where the dot-com boom stood in early 1999, about a year before the top. That is an uncomfortable place to be told you are standing, so it helps to know exactly how rare the neighborhood is. Across 145 years of monthly data, only 19 months have ever printed a CAPE at or above today’s level. Eighteen of them sit between March 1999 and September 2000. The nineteenth is 2026. Even the 2021 peak, which felt frothy at the time, topped out at 38.6.
The bubble-deniers respond with a fair objection. The modern CAPE runs structurally hotter than its own history. Accounting rules now force harsher writedowns in bad years, which depresses the ten-year earnings average. Buybacks lift per-share earnings growth in a way the 1900s never saw. The index itself migrated from capital-heavy industrials toward software businesses that reasonably command higher multiples. All of that means comparing 40.7 against the long-run average of 17.5 overstates the excess, and a level-for-level mapping onto 1999 is too harsh. The objection is legitimate. Notice, though, what it does and does not buy you. It argues today’s 40.7 is less extreme than 1999’s 40.7. It does not argue the reading is normal, because every structural adjustment in that list was already in force in 2021, when the CAPE could not reach 40.
The concentration number
The second shared measurement is how much of the index sits in its largest names. As of 2026, the top ten holdings of SPY, the largest S&P 500 fund, sum to 37.7 percent of the portfolio, led by Nvidia at 7.8 percent and Apple at 7.6 percent. RBC Wealth Management, counting the ten largest companies in the index itself, put the number near 41 percent at the end of 2025. For comparison, RBC’s history shows the top ten peaked at roughly 27 percent of the index during 2000 and finished that year around 23 percent.
That comparison deserves precision, because it is the one measurement where today is unambiguously past the dot-com mark. Valuation sits below the 1999 peak. Concentration sits far above it, by roughly ten to fourteen percentage points depending on the counting convention. An investor who buys “the market” through an index fund is making a larger bet on ten companies than an index investor made at the height of the dot-com era.
What concentration does to you is often misstated, so it is worth being precise. Concentration is a return forecast for nobody. It is a risk statement. It says the diversification you think you bought is thinner than the label implies, and that your index fund’s next decade depends heavily on whether a handful of AI-linked business plans work out. The deniers correctly note that today’s ten are more profitable than any leadership cohort in history. The callers correctly note that this was also said, with numbers, about the leadership of 2000. Same measurement, two readings.
The earnings number
The third measurement is the one the deniers lead with, and it is genuinely strong. The flagship company of this boom reports earnings that the flagship companies of 1999 never approached. For its quarter ended 2026, Nvidia reported revenue of $81.6 billion, up 85 percent from a year earlier, with a GAAP gross margin of 74.9 percent. Reported net income was $58.3 billion, though that includes $15.9 billion of gains on equity investments. Strip those out and the operating business still earned roughly $42 billion, a net margin above 50 percent. Whatever this is, it is a real business selling real hardware to customers who pay real money.
Here is the complication the callers point to, and it also survives contact with the data. The dot-com boom had real earnings too. In Shiller’s data, the real earnings of the S&P 500 grew 58 percent over the ten years ending December 1999. Over the ten years ending June 2024, the latest month in the published earnings series, they grew 45 percent. The profitless dot-coms everyone remembers were the froth at the edge of that boom. Its center was Microsoft, Intel, and Cisco, all solidly profitable, all growing fast, and all priced so far ahead of that growth that Microsoft’s share price did not hold above its December 1999 peak until October 2016, roughly 17 years later, while the business itself kept growing the entire time.
That is the honest state of the earnings argument. Today’s leaders earn more, and by a wide margin. What broke investors in 2000 was never a shortage of profits at the top of the index. It was the price paid per dollar of those profits, and the price question is exactly what the CAPE above answers with its uncomfortable early-1999 reading. The strongest fact in the deniers’ case and the strongest fact in the callers’ case are, once again, the same fact viewed from opposite sides.
What calling the top early cost last time
Suppose you had been handed the answer in advance. In December 1996 a credible authority tells you the market is irrationally exuberant, and you act on it, selling everything the day of the speech. You are about to be proven completely right, and here is what being right costs you.
From December 1996 to December 1999, the S&P 500 returned another 101 percent with dividends reinvested, 89 percent after inflation. The market you left doubled without you. Then the crash you predicted arrives, one of the worst in modern history, and it still does not hand you a victory. At the bottom in September 2002, the total-return index stood 27 percent above the level where you sold, 11 percent after inflation. In real total-return terms, the market spent exactly two months below your December 1996 exit point over the entire span since, and those two months were in early 2009, twelve years after the speech. The seller of 1996 was right about the bubble and never got a clean chance to profit from it.
This is the asymmetry that should discipline anyone tempted to act on the numbers above. If today is 1997, selling costs you a possible doubling. If today is 1999, staying invested costs you a drawdown that history says long-horizon holders survived, provided they kept buying through it. Timing requires being right twice, on the top and on the bottom, and the 1990s punished people who were right once with three years of watching.
What an index investor should do
The measured answer to the headline question: by the valuation ruler this looks like early 1999, by the concentration ruler it is past 2000, and by the earnings ruler it is unlike 1999 in the one way that camp cares about. The rulers disagree because they measure different things. None of them is a timing signal, and the 1990s showed what acting on them as one costs.
What a high CAPE does carry is information about the next decade. Across Shiller’s history, the correlation between starting valuation and the following ten years of real returns is about minus 0.5, a real relationship with enormous scatter around it. A 40.7 start shifts the odds toward a leaner decade. It shifted them the same way through the 2010s, and the ten years ending 2026 still delivered 11.6 percent a year in real total return, which is a useful reminder of how wide that scatter runs.
So the actions that follow are boring by design. Set your return expectations for the coming decade below the recent past, and check that your plan still closes at those lower numbers. If it does not, the lever that responds is your savings rate, the one input you control outright. Rebalance on schedule, because concentration at 38 to 41 percent means your index fund has quietly become a larger AI position than you chose, and rebalancing into bonds or international holdings is the undramatic way to keep that bet sized to your risk capacity. Then stop. Selling everything because this might be 1999 is a bet the 1996 seller already ran for you, with the results above. The numbers are worth measuring precisely so that you can respond to them proportionally, and the proportional response to an expensive, concentrated, genuinely profitable market is a plan that assumes less and saves more, held by someone who stays in their seat.
Sources
- Robert J. Shiller, “Irrational Exuberance” online dataset (econ.yale.edu/~shiller), CAPE / P/E10 and earnings series through September 2024, accessed 2026.
- multpl.com, Shiller PE ratio, current and monthly readings through 2026.
- S&P 500 total-return calculations from Shiller’s data spliced to the official S&P 500 total-return index (^SP500TR via Yahoo Finance) and CPI (FRED CPIAUCSL), through 2026.
- stockanalysis.com, SPY holdings and weights as of 2026.
- RBC Wealth Management, “The ‘Great Narrowing’: S&P 500 concentration,” 2026.
- Nvidia investor relations, “NVIDIA Announces Financial Results for First Quarter Fiscal 2027,” 2026.
- Federal Reserve Board, Alan Greenspan, “The Challenge of Central Banking in a Democratic Society,” December 5, 1996.
- Fortune, “How Microsoft Made Its Stock Great Again,” October 21, 2016 (shares first exceeding their 1999 peak).